If you will read this entire article you will find out why the new Orphek Atlantik iCon BREAKS ALL RECORDS
Danireef blog is the greatest Italian source for reefers in Europe and for our surprise and excitement has published recently a complete review of our latest launch, the Orphek Atlantik iCon.
Since it is a 3 pages article filled with many detailed measurements we decided to divide into 3 parts. In this second post you will find PAR measurements results that will blow your mind.
You will also be able to compare our Atlantik iCon performance with other brands with cool graphs.
If you have missed the first post click HERE
*We have also published another great review LED by LED by Dana Riddle (click HERE in case you have missed).
Orphek Atlantik iCon in DaniReef LAB - PART2
DaniReef LAB working method for PAR measurement:
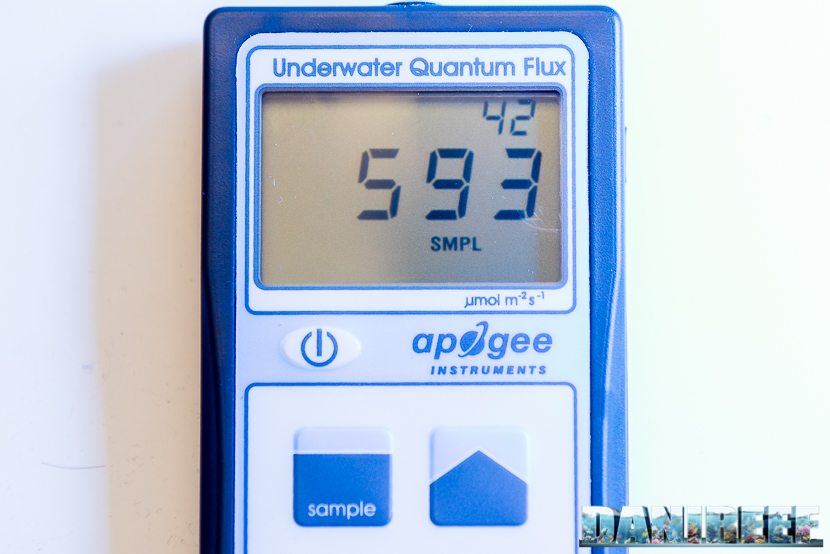
The Quantum Meter MQ-510 measuring the PAR , expressed in PFFD or density photosynthetic photon flux ( photosynthetic photon flux density ) in mol m-2 s-1.
The instrument is calibrated to work underwater, so when used in air the measured value must be divided by 1.32 which is the immersion factor. Since there was no water, at the time of the tests, the values that you will see will always be the ones that are already corrected.
In order to test the light, a 70 × 70 cm base was built with 17 points marked where to place the sensor of the Quantum Meter MQ-510.
To position the LED fixture we have used 20cm (7.87in), 40cm (15.7in) and 60cm (23.6in) height measures. This will allow us to create curves in space that can be compared with those of other lights, always at the given distances.
Note that this distance is measured between the sensor base and the light base. In reality, the distance must be decreased by 3.5cm (1.37in) which is the height of the measuring cylinder and increased by 0.5cm (0.19in) which is the size of the spacers that allow us to keep the ceiling light raised.
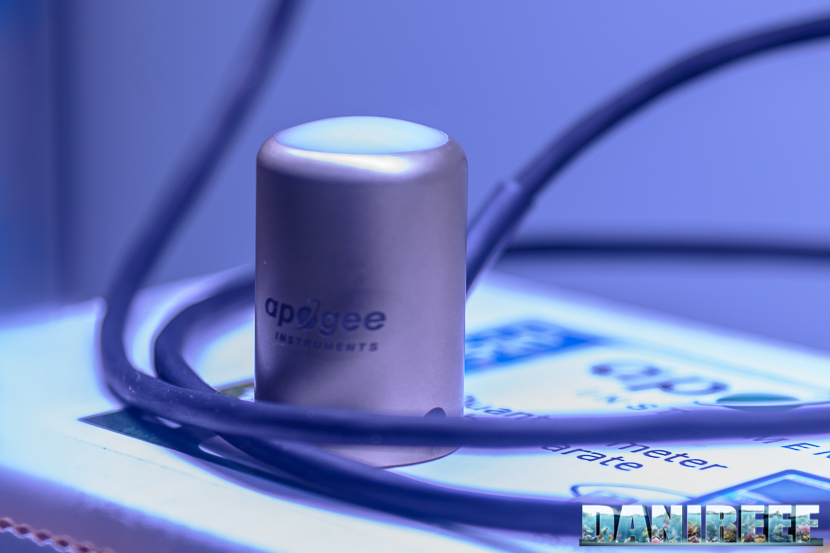
In total, the three measurements will then be made at 17cm (6.69in), 37cm (14.56in) and 57cm (22.44in) away, in the air, and the corrective factor will be applied.
The PAR values found at 17cm/6.69in
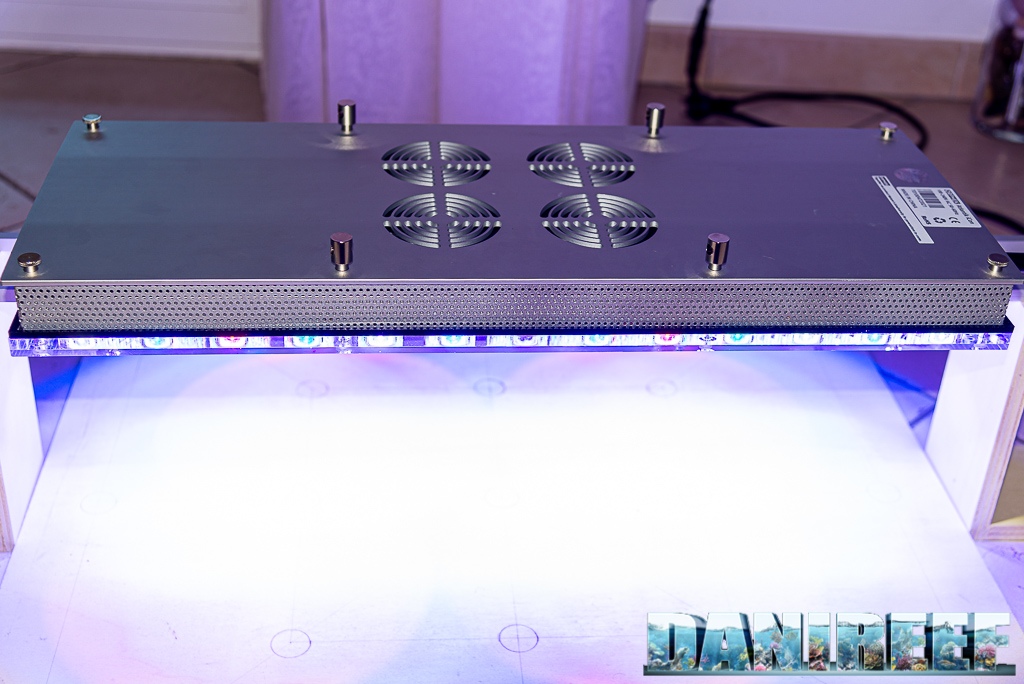
The Orphek iCon LED light, was placed at the canons 17cm/6.69in away from our reading panel.
The points not indicated on the scoreboard have been estimated in the following table.
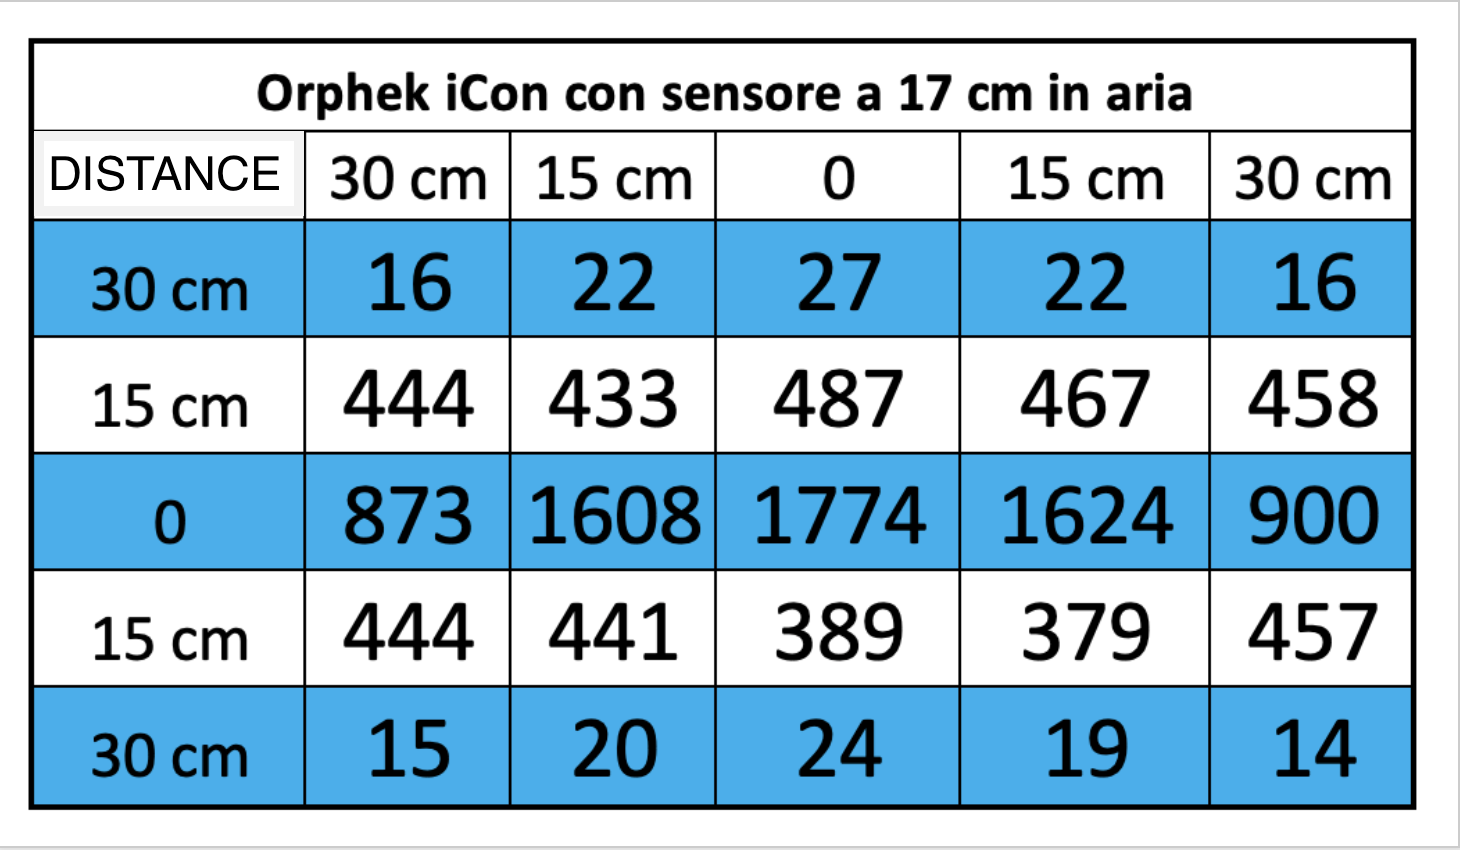
And this is the corresponding graph.
We went back to our classic graph scale to be able to compare similar LED lights:
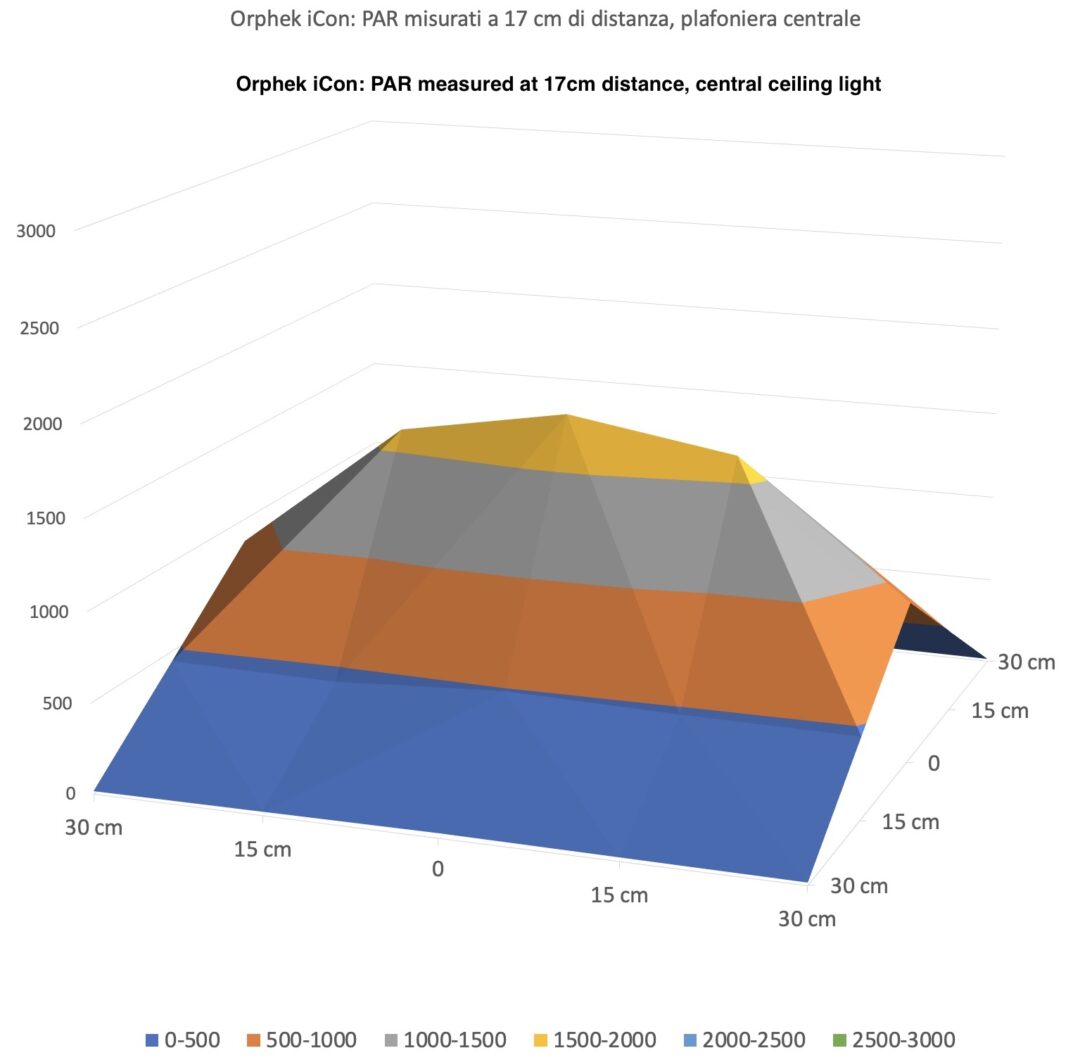
The first measurement has the characteristic of having a limited distance between the LED light and the sensor. The expressed PAR values are very high in the center but above all very full along the entire length, while the front and rear drop a little sharply. This is also obvious considering the size of the LED light of 61.5 × 23.8 cm. (24.21 X 9.37 inches)
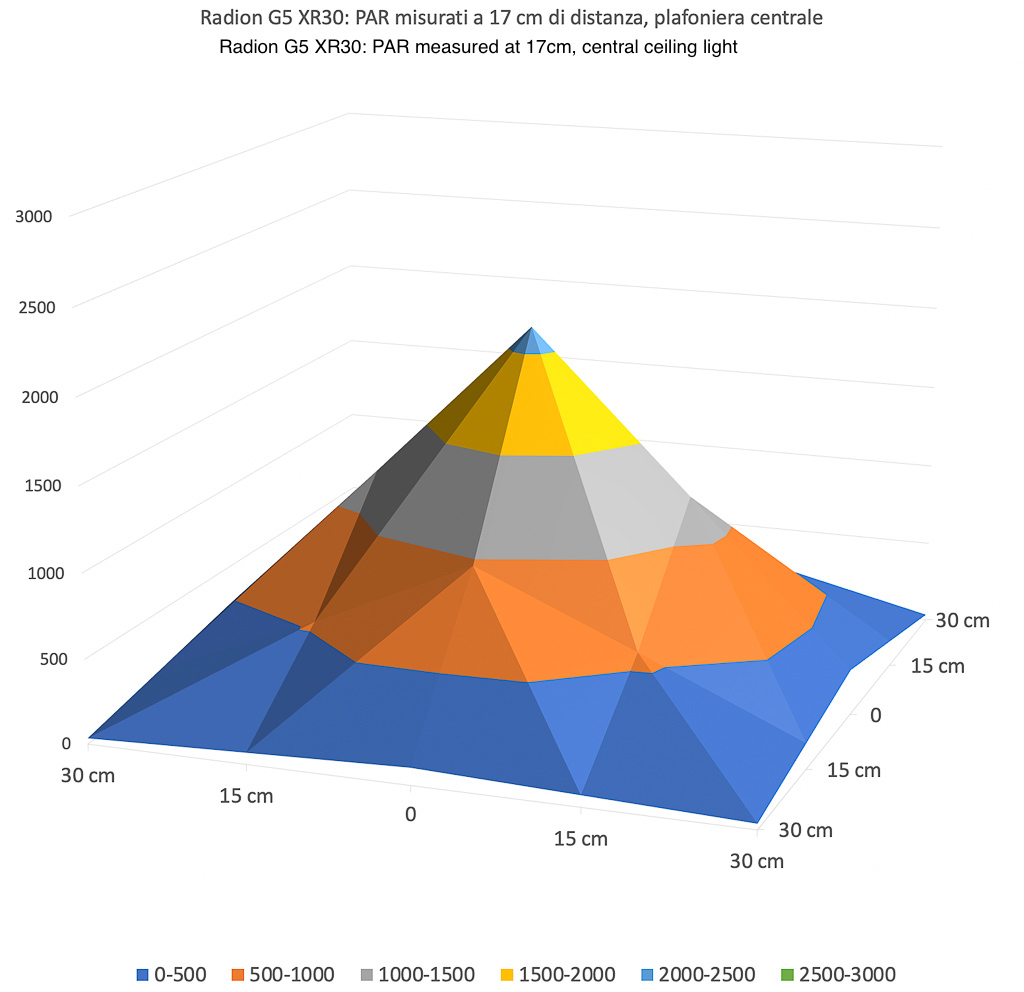
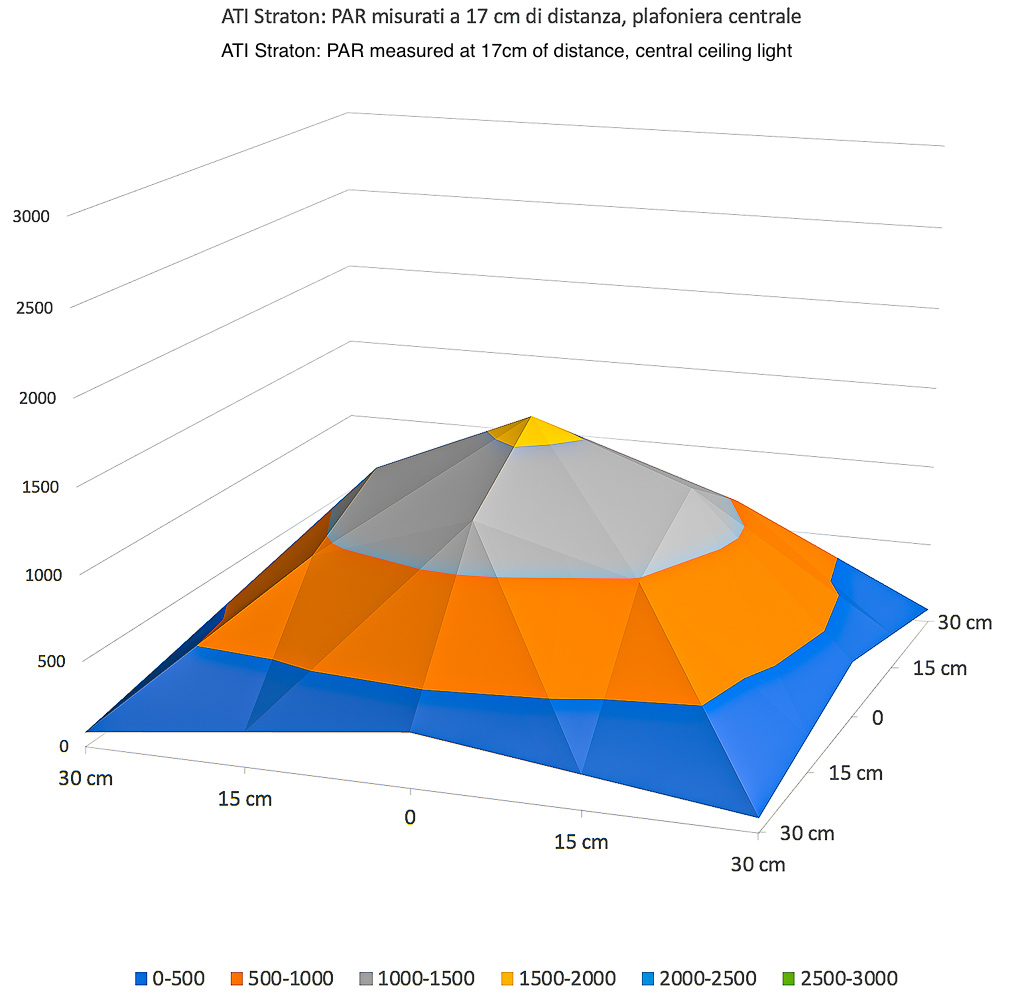
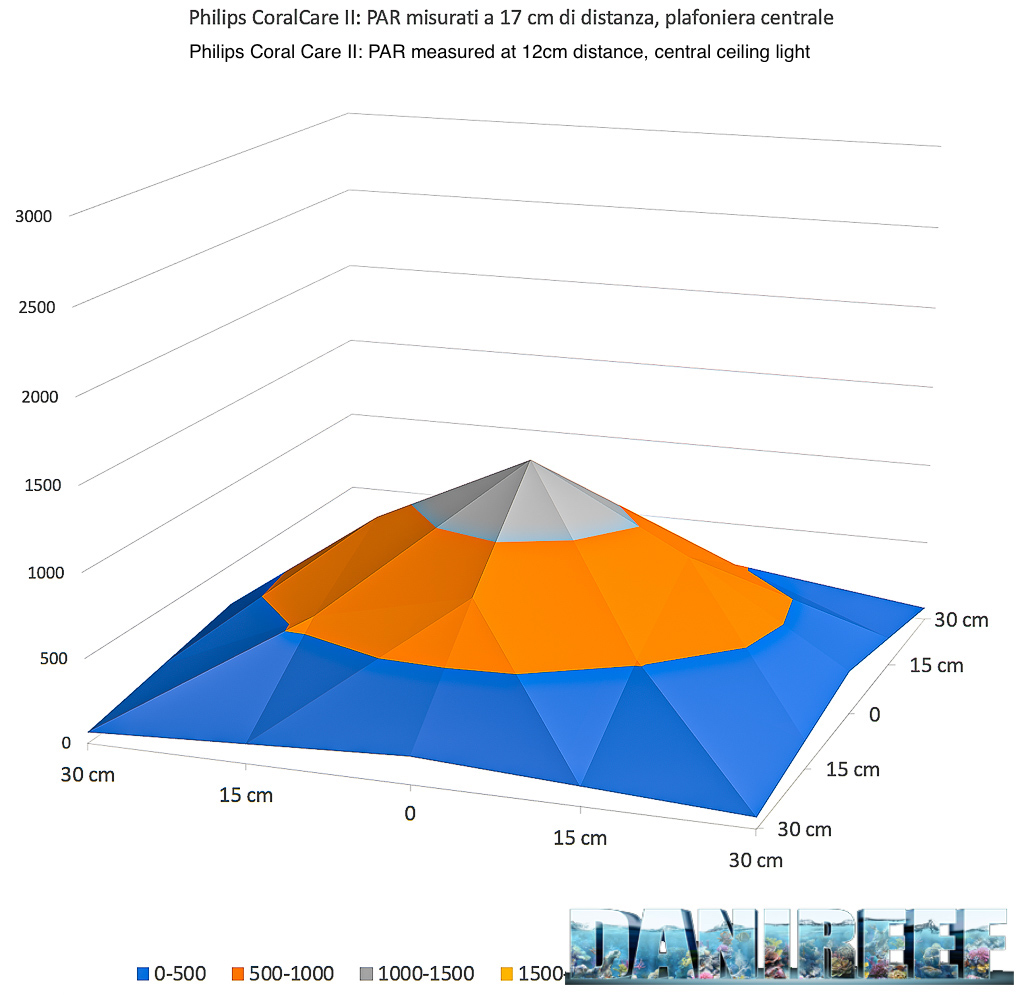
Orphek Atlantik iCon PAR Measures and others:
The graphs have the same scale and the color is the same at comparable PAR level. The comparison with three LED lights of the same class, although somewhat different from consumption, highlights how the Radions have a greater peak power, but a distribution that is still very centered, while ATI and Philips, despite being rather centered, show a greater coverage in front and behind.
The PAR values found at 37cm/14.56in
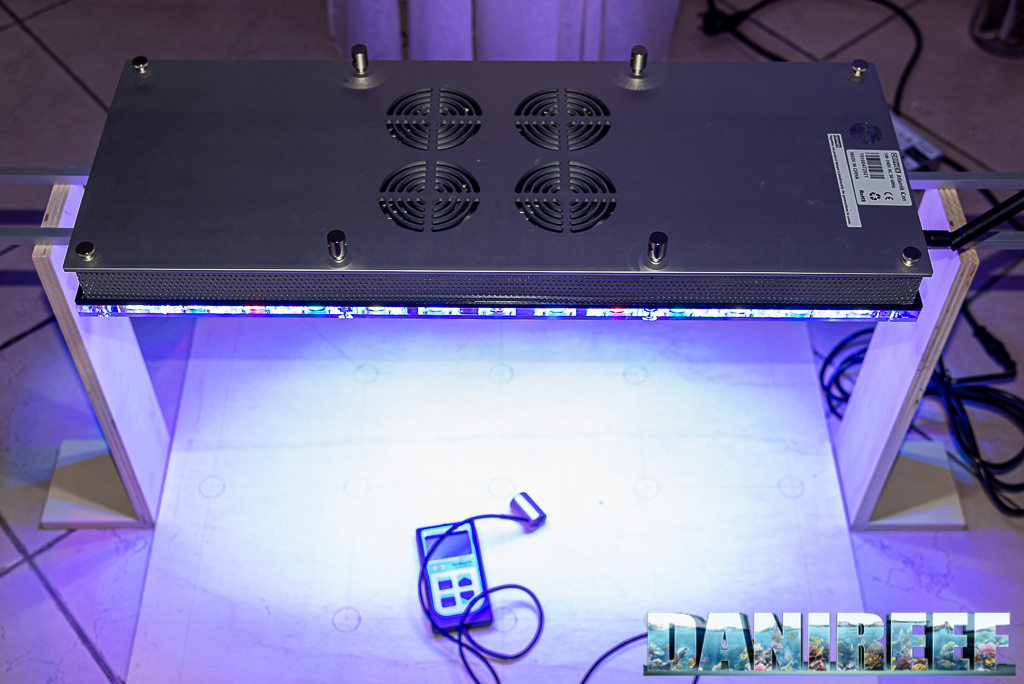
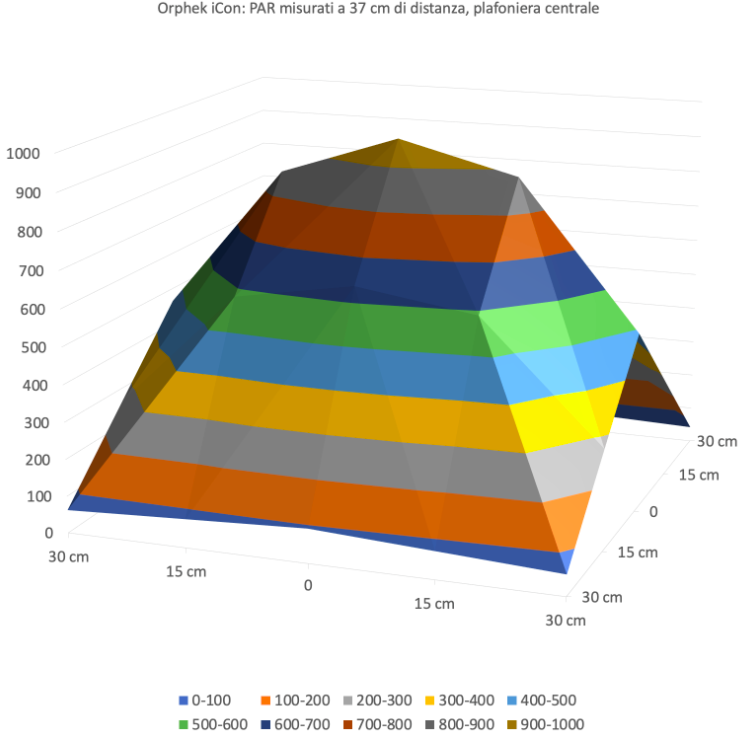
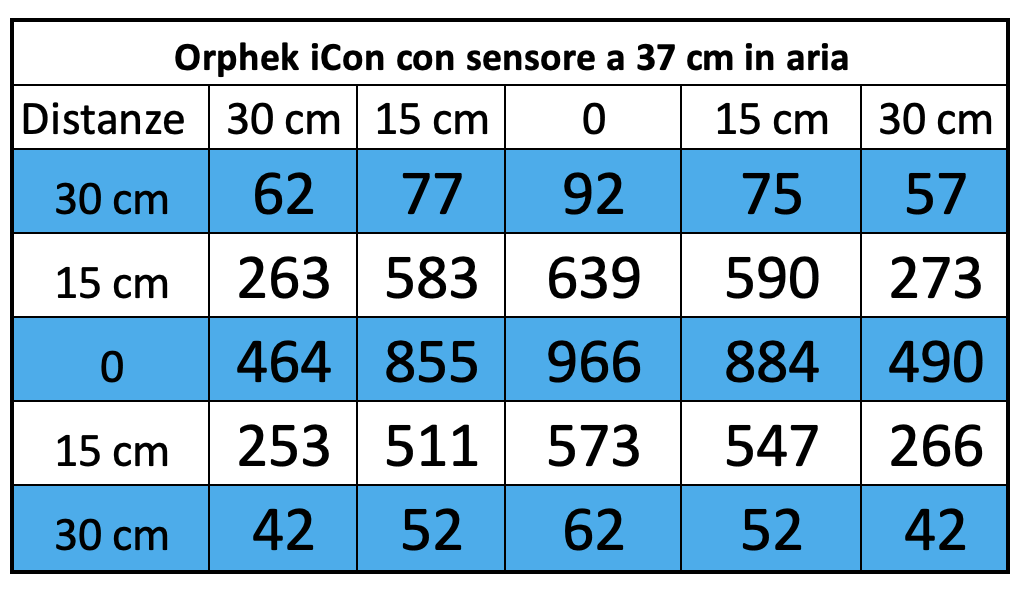
We placed 37cm/14.56in away, these are the measured values:
And this is the corresponding graph:
Orphek iCon: PAR measured 37cm/14.56" of distance, central ceiling light
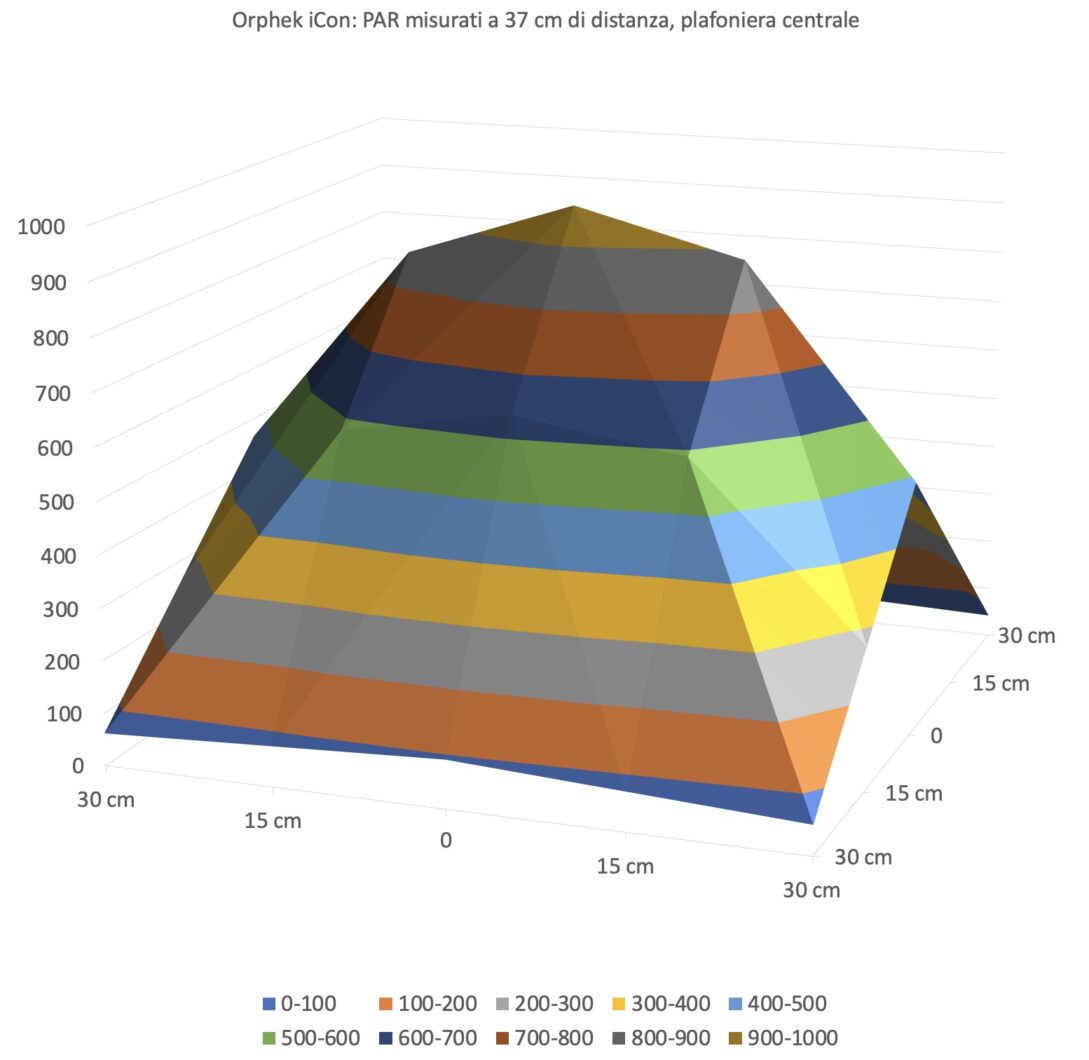
By increasing the space between the Atlantik iCon LED light and the sensor, the curve takes on a full connotation. The peak value is incredibly high, as it is close to 1000 PAR !!! The central value decreases from 1774 to 966 μmol m-2 s-1.
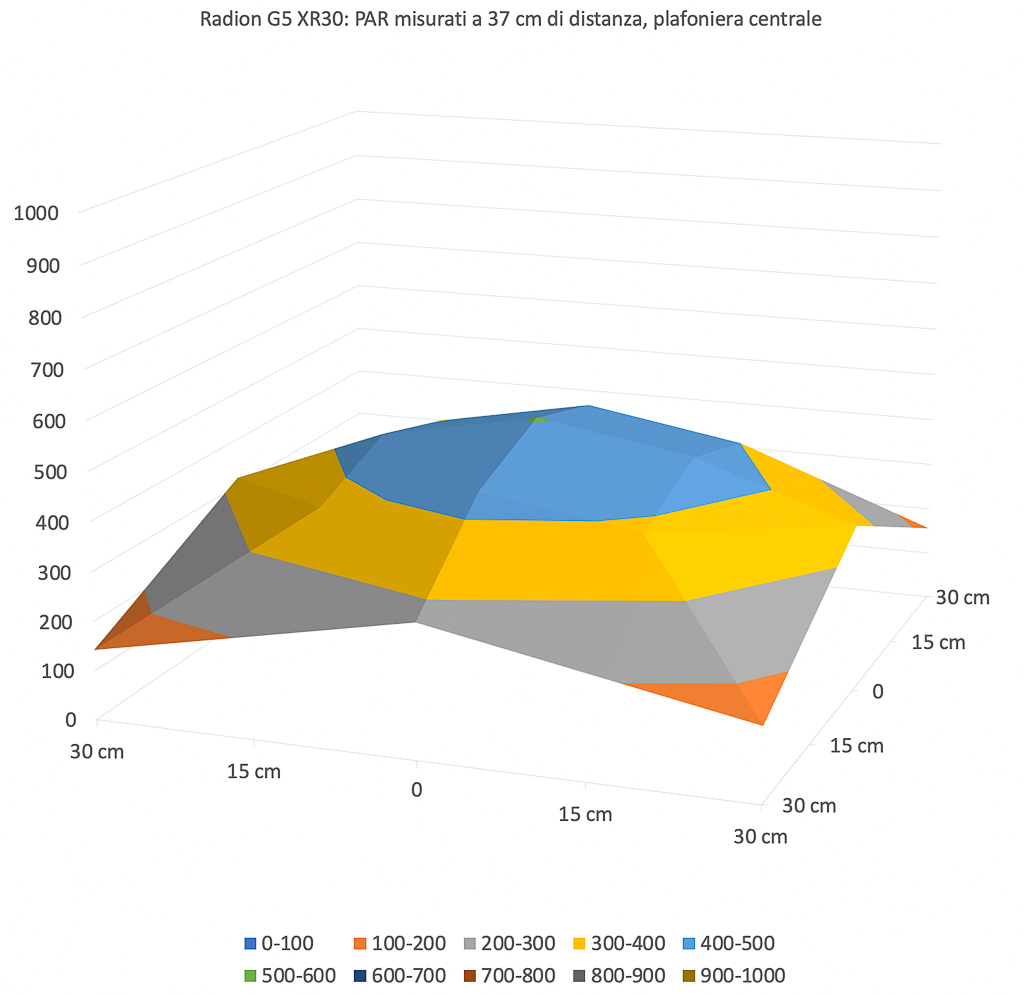
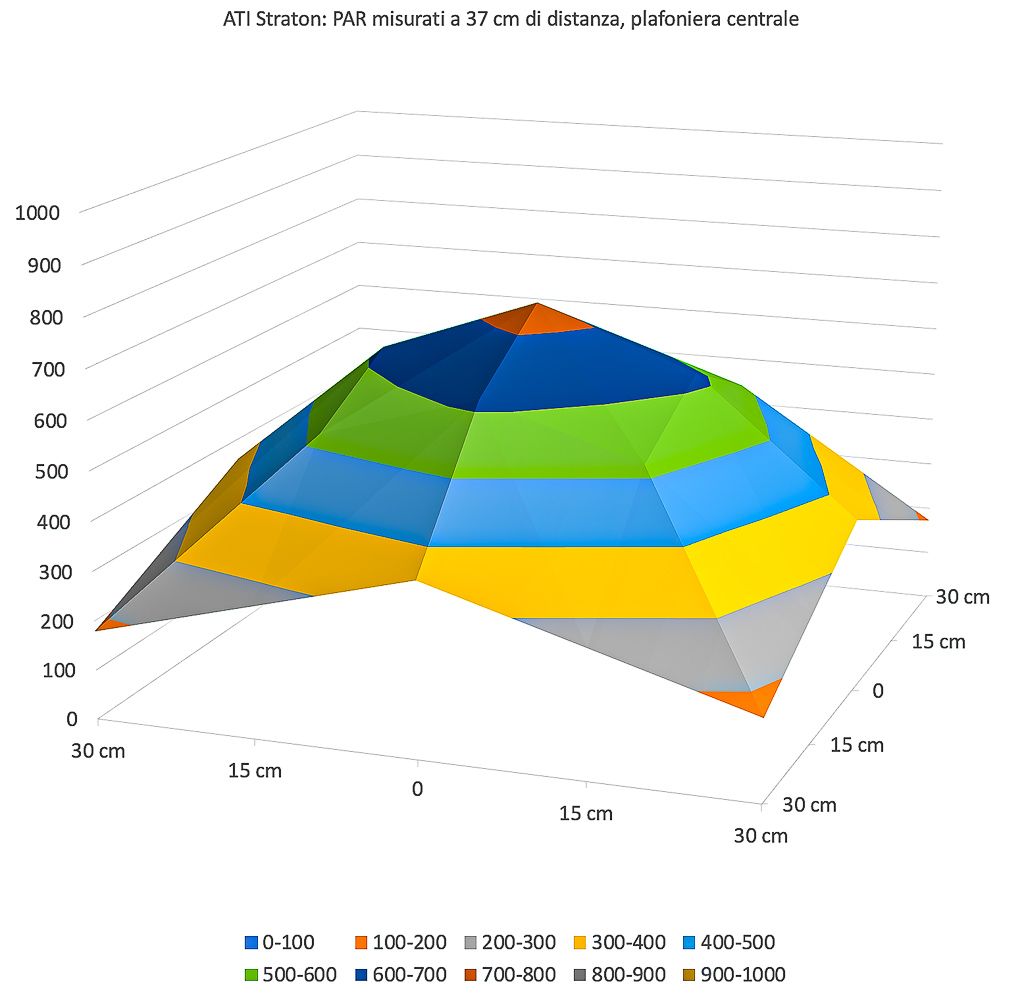
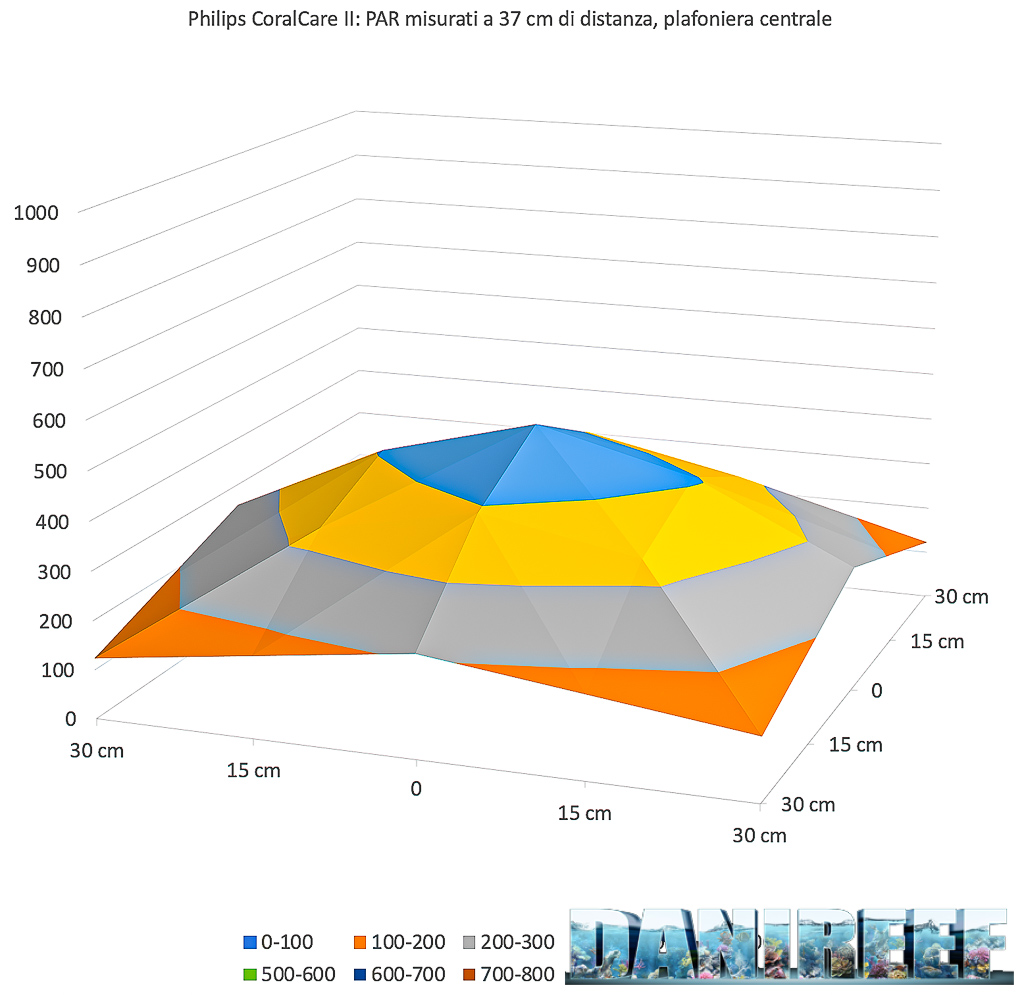
Moving away 37cm/14.56in from the LED light, the Orphek Atlantik iCon graph remains similar, but the power is practically record-breaking, almost 1000 PAR as we have said.
While the three antagonists, although with slightly lower power, are placed at about half, apart from the Straton which instead is halfway between Orphek and the Radio-CoralCare duo. On the sides the Orphek wins hands down, while in front and behind it falls more than the others, where for uniformity the Philips wins despite having less power than all the others.
The PAR values found at 57cm/22.44in
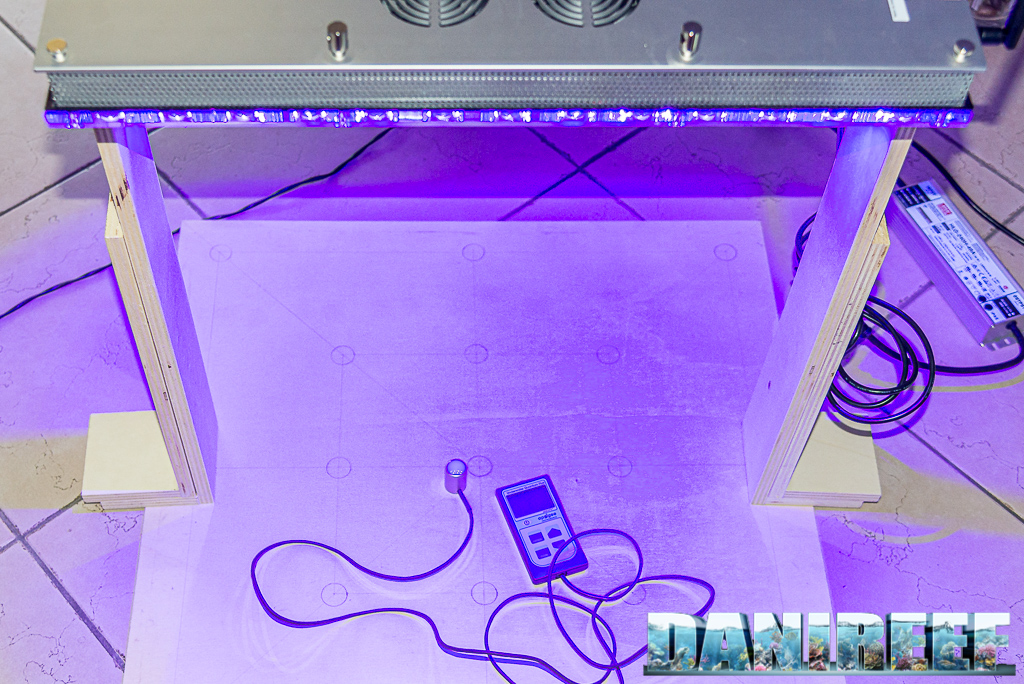
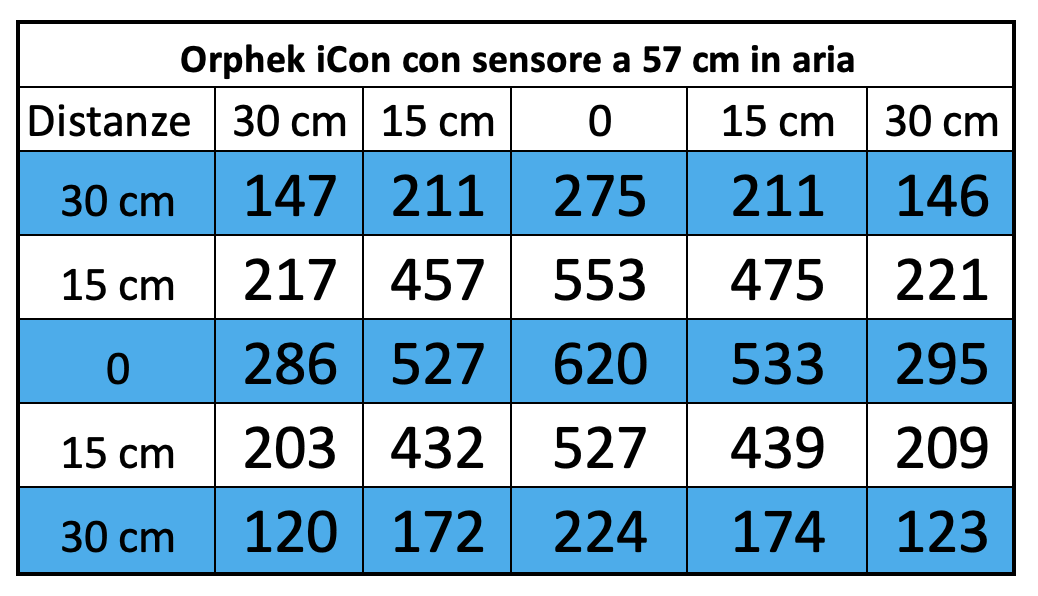
Finally we got as far as possible, at 57cm/22.24in and these are the measured values:
And this is the corresponding graph:
Orphek iCon: measured with 60cm/23.62in of distance, central ceiling light
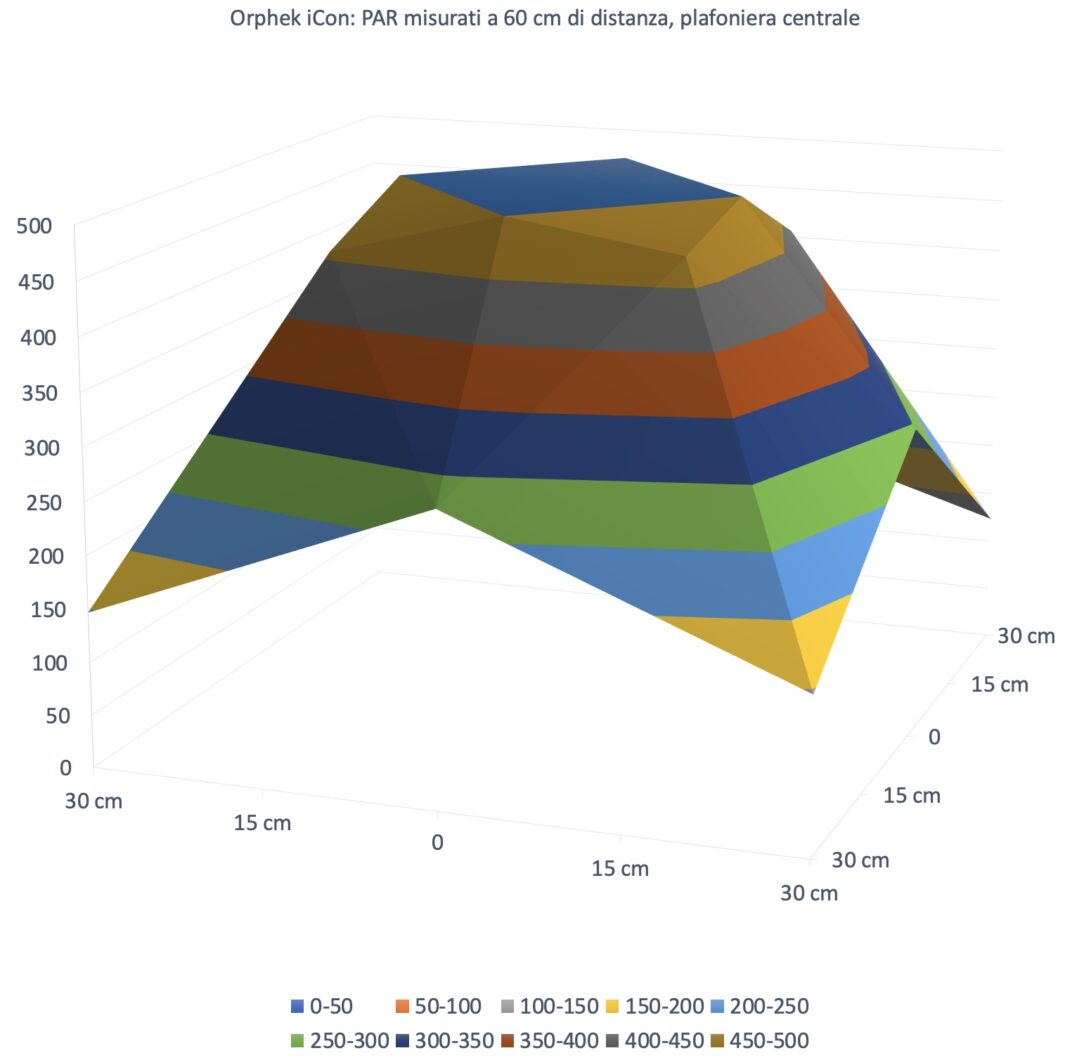
Until now we have always used a chart with the maximum place at 500 PAR which we thought was very conservative, here, the Atlantik iCon went much further, measuring 620 PAR peak in the center. For this reason we have recalibrated the curve, only for this LED light, to make you better appreciate the distribution of light power.
Orphek iCon: PAR measured at 60cm/23.62in of distance, central ceiling light
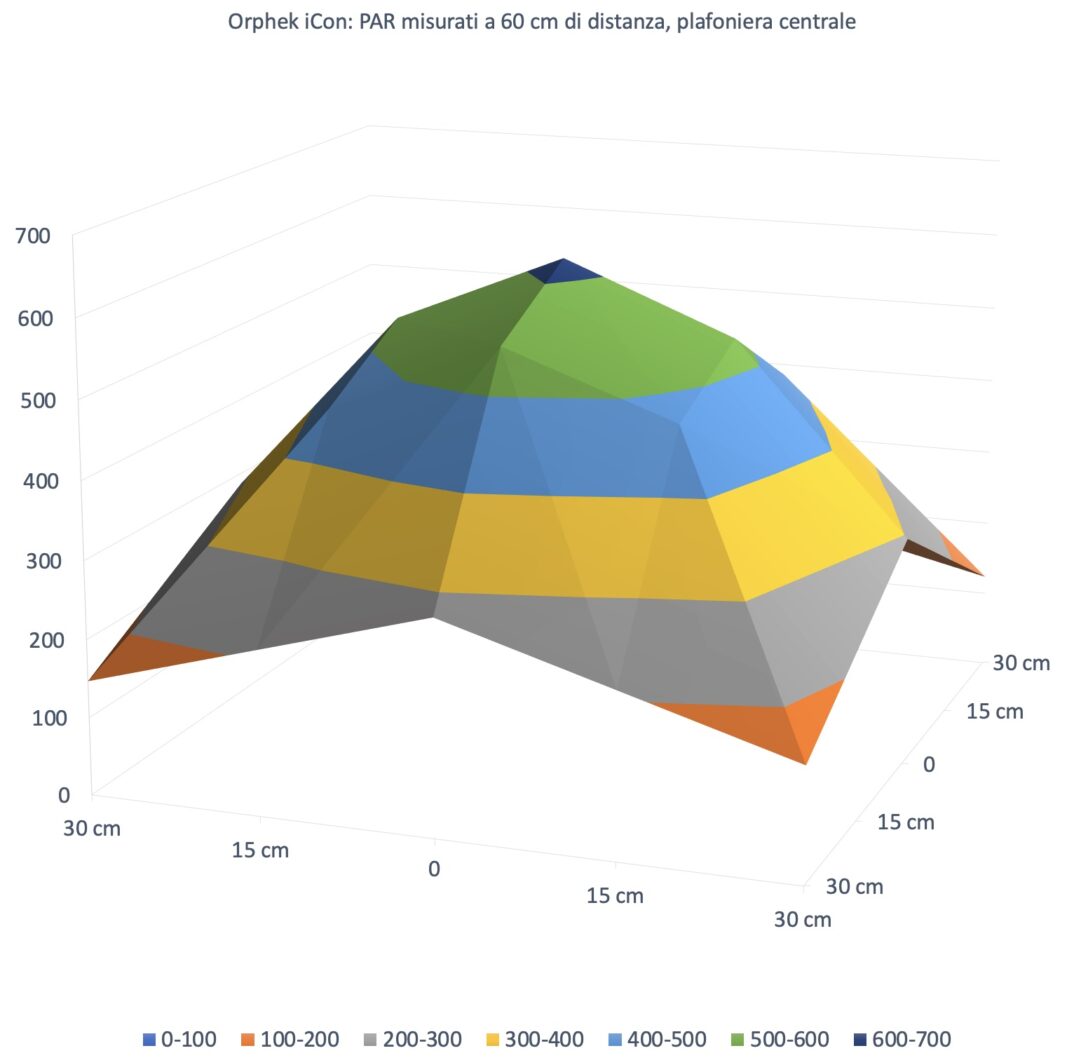
But to compare the following LED lights you have to look at the first graph.
Just look at the graph to understand the power expressed along the central line of the Atlantik iCon LED light. The central value still decreases from 1774 to 966 to 620 μmol m-2 s-1.
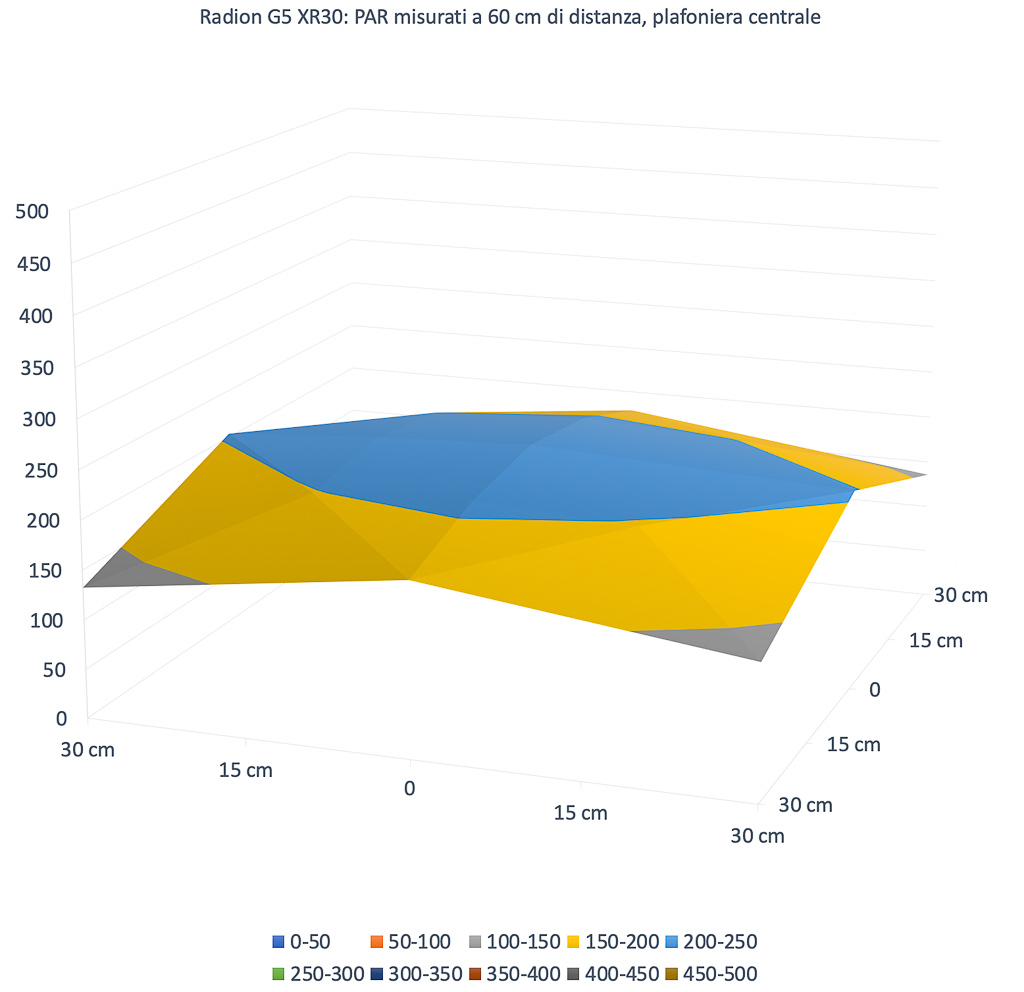


The differences remain the same as at 37cm/14.56in. At this distance the Orphek Atlantik iCon is even more impressive.
But the other three cover the center-to-edge distance more evenly. Straton better than the other two, but you must always remember the differences in the power of the three LED lights.
The PAR in the center in the different configurations
Let's continue with our technical surveys. Below we see how in a graph, the PAR measurements are lowered to the center in the three different distances of the test.
Orphek iCon: PAR dispersion based on the measured distance from the center
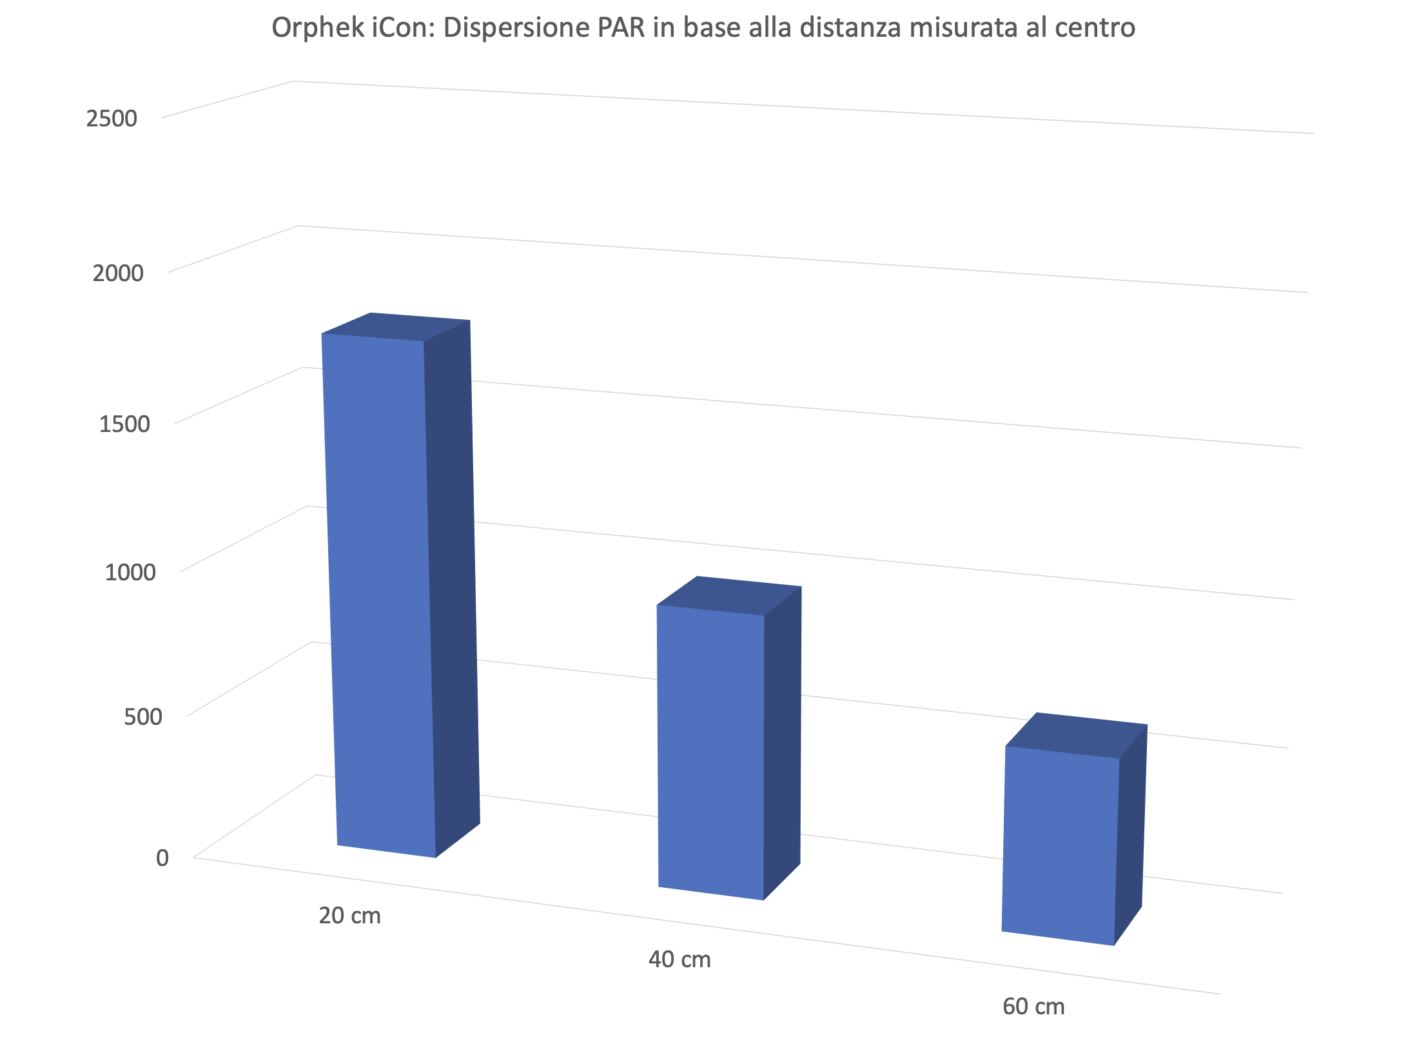
Energy variation of the Orphek Atlantik iCon based on distance
Orphek iCon: Total energy emitted by the light in the chosen interval
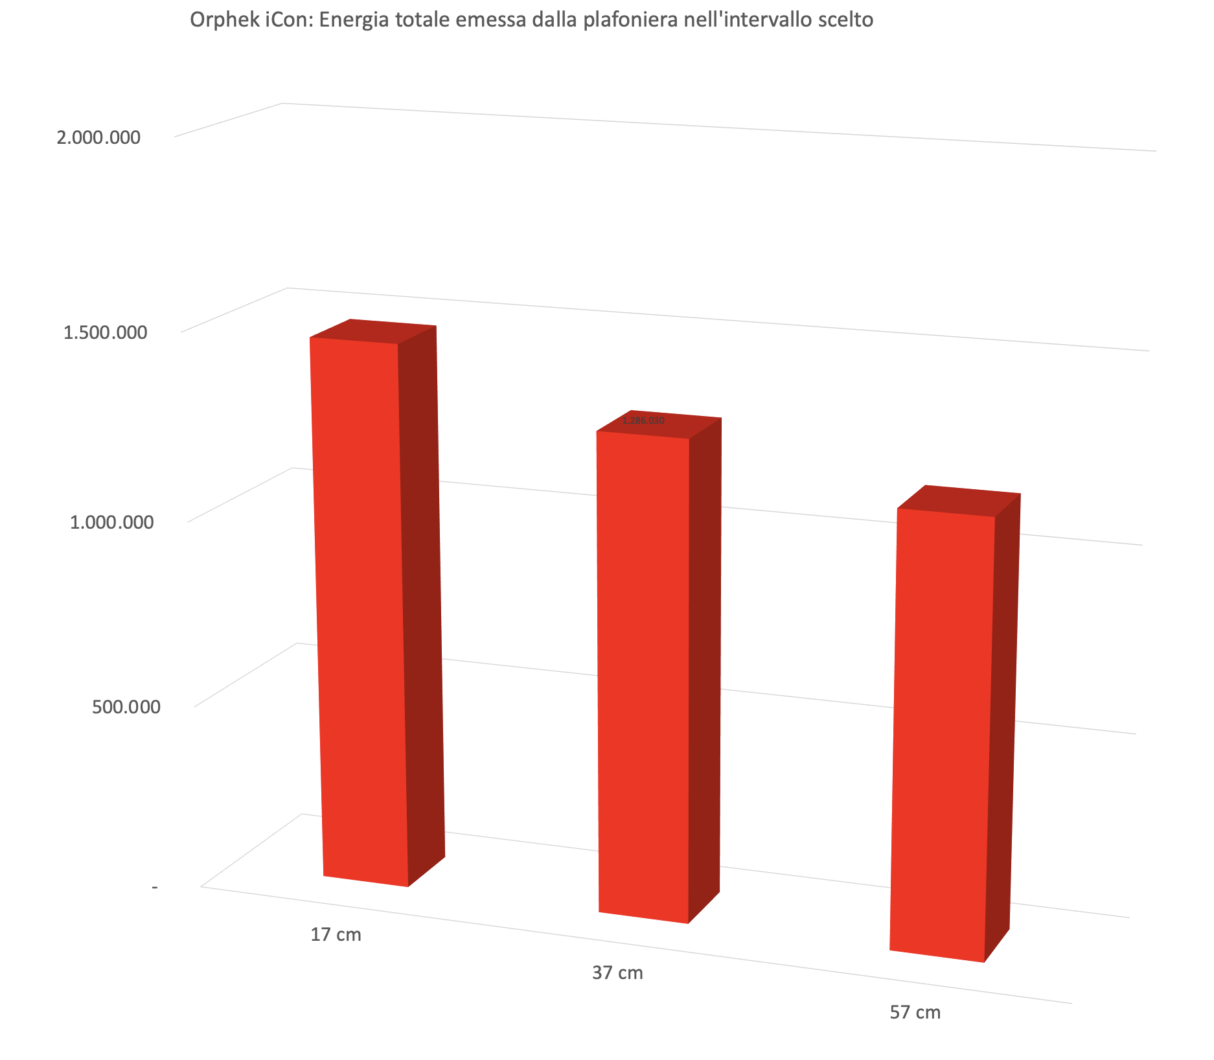
In my opinion, this is the most significant data among those measured, and the most comparable. The energy variation. The volumes subtended by the three surfaces you have seen previously have been calculated.
Because it is obvious that moving away from the LED light the PAR values decrease, but they also decrease because the light illuminates a larger space. In this way we try to take into account all the light energy contained in the hypothetical square of 60cm/23.62in subtended by the LED light. And it can be seen that the three values 1.469.474, 1.286.030 and 1.155.746 take on a different connotation with respect to the values measured in the center.
When the former are waning because distances increase, the underlying area, that is the energy, decreases less, because the "bulk" of the "concentrated" ceiling light remains in the center. This is the theory.
For the iCon the values are almost "identical" to the three distances, this means that all the light expressed, or in any case most of it, remains within 60cm/23.62in.
Excellent for tanks up to 60cm/23.62in wide, a little less for aquariums that are 70/27.65in or 80cm/31.49in wide instead.
Values per channel in the center in the three distances
We also measured the values for each individual channel, but we did it only in the center, to give you an idea of what contribution the different channels have on the PAR output.
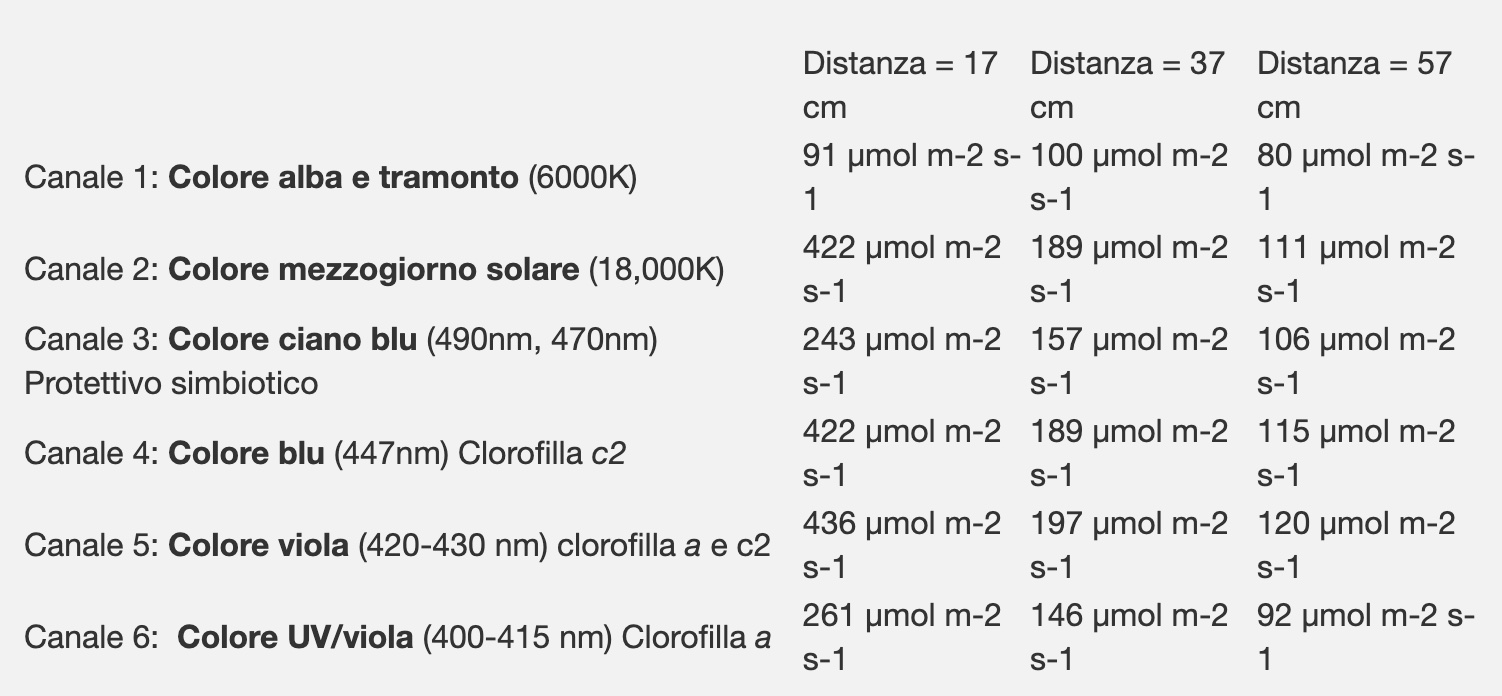
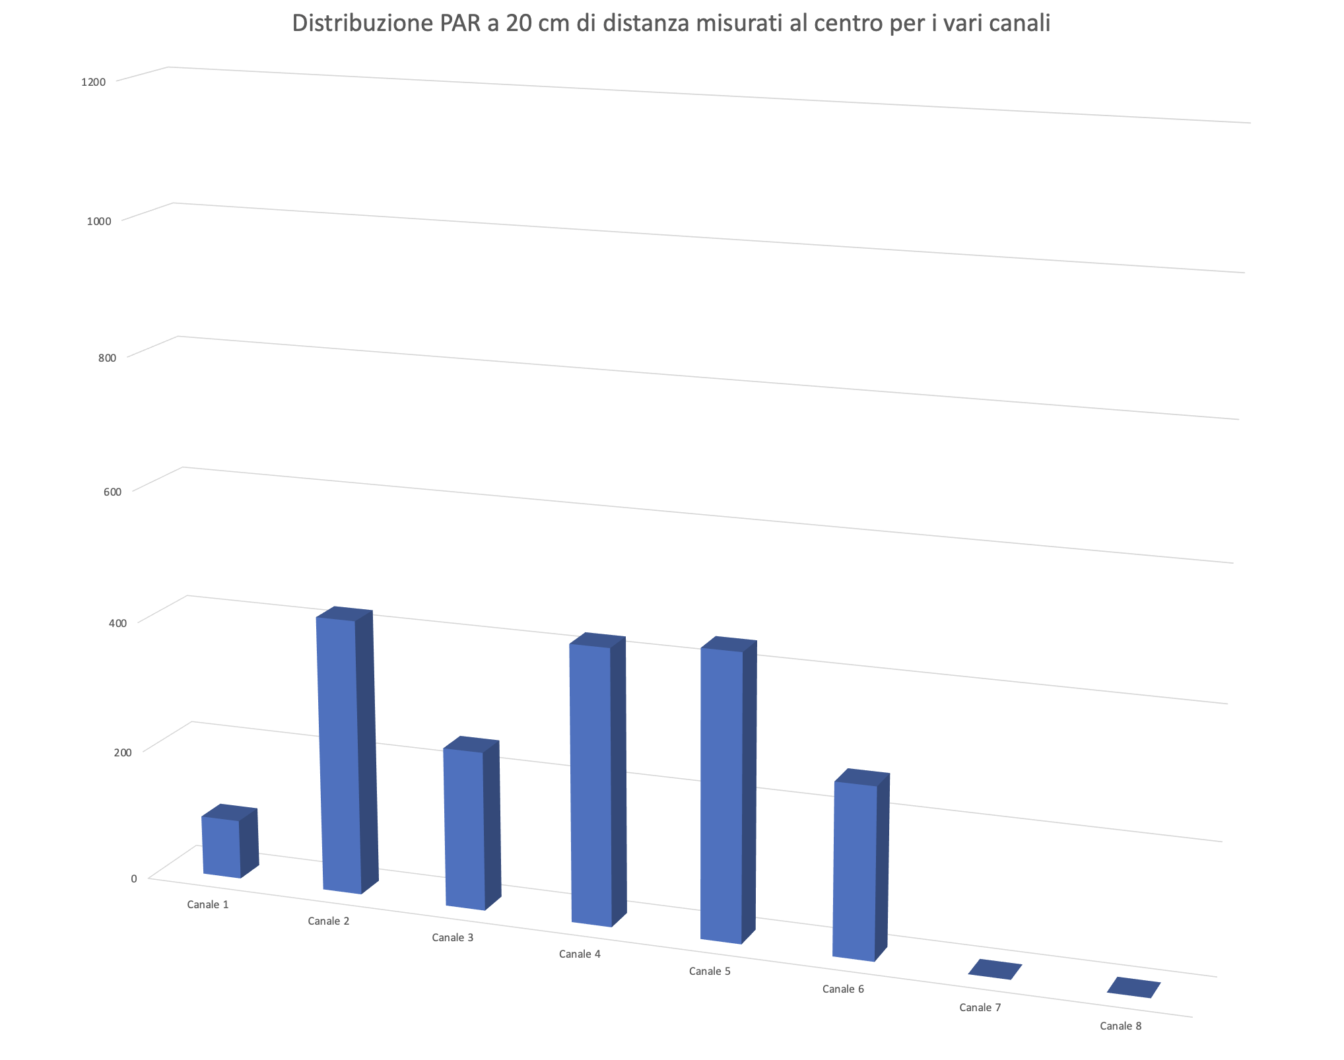
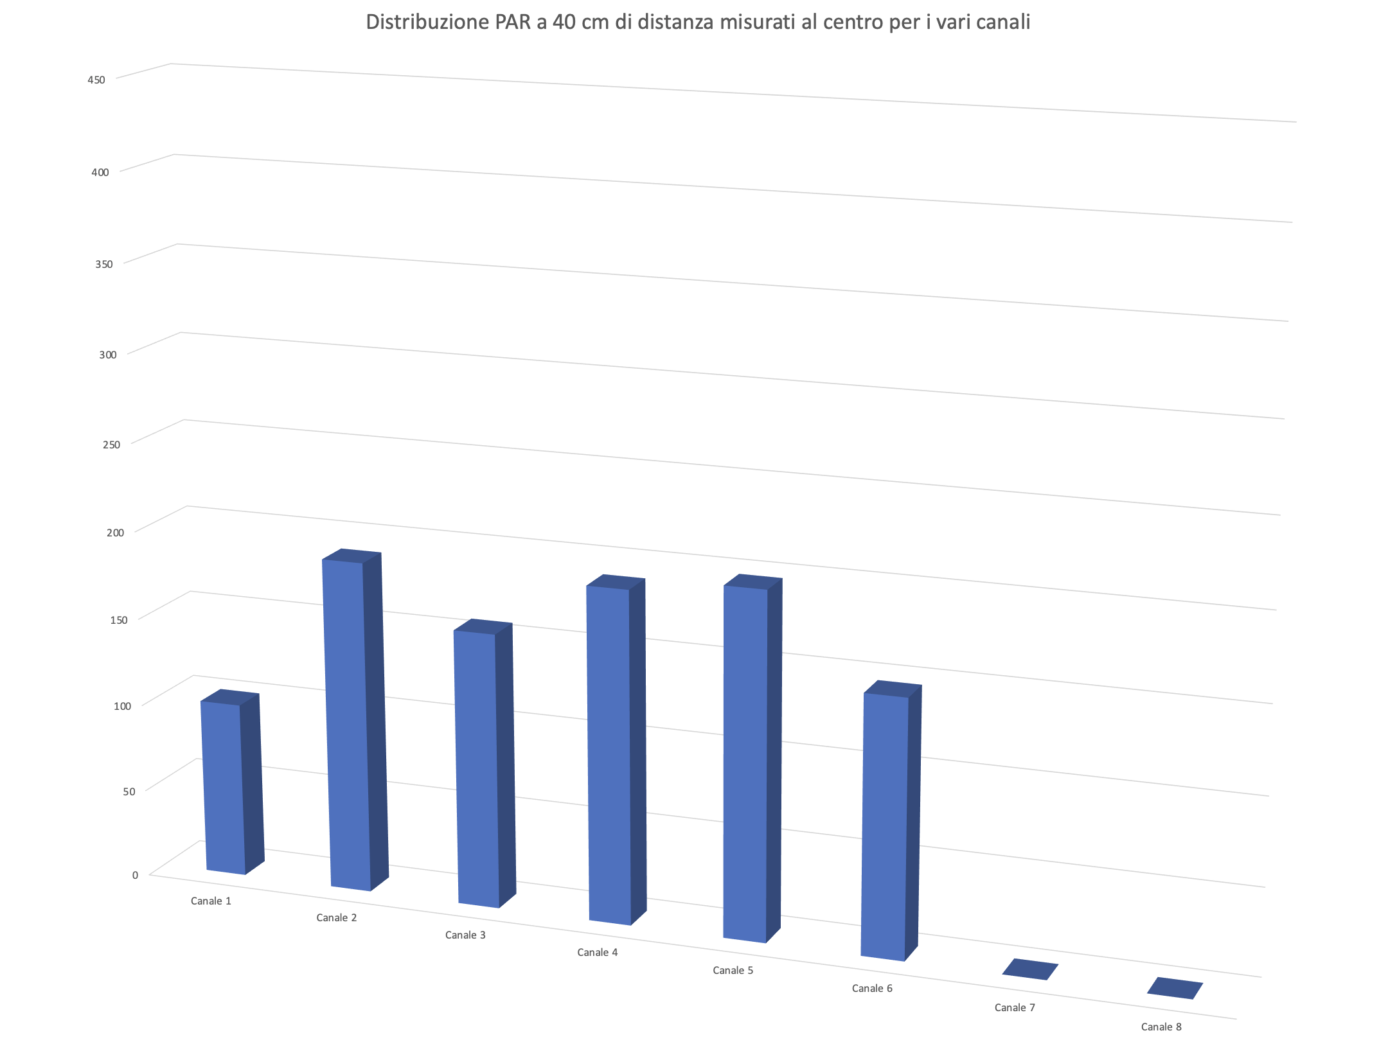
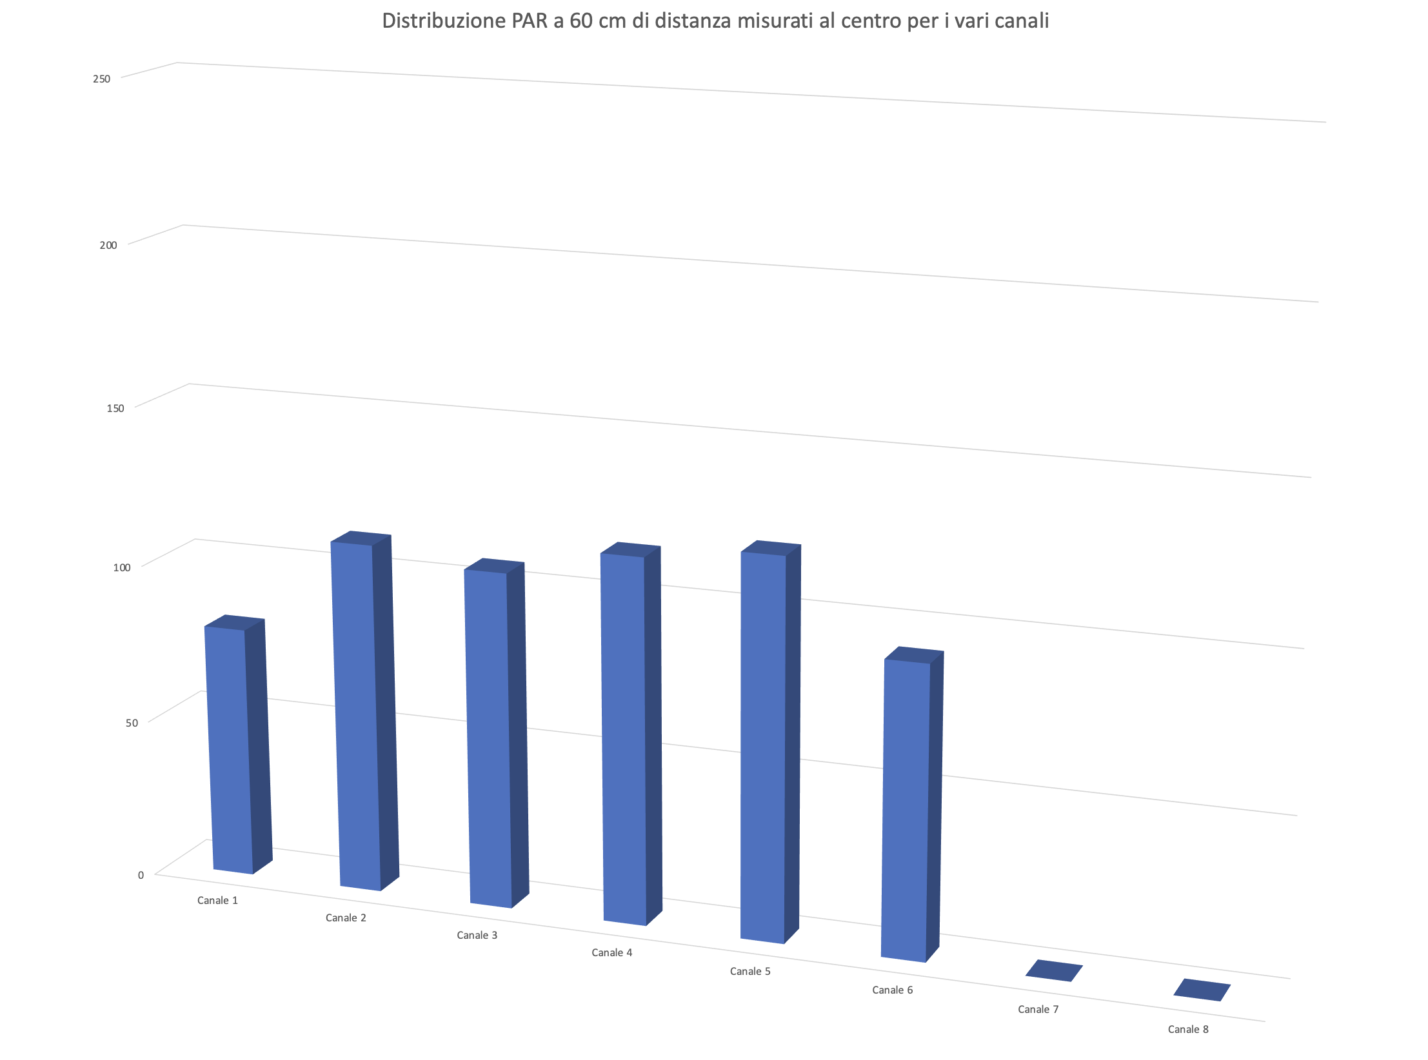
The six channels are obviously different, but not too much. Furthermore, the single incidence varies a lot with distance, probably because when they are very close to the instrument the light of the LEDs does not expand sufficiently to excite it completely. However, we see that channels 2, 4 and 5 are the ones with the highest PARs, but apart from the first one, the whitest of all, the others are quite close to 40cm/15.74in away.
Consumption
The detection of instantaneous consumption was made possible thanks to the use of the convenient RCE PM600 instrument which is also able to measure the Cos (fi) (or phase shift). The result is given directly in watts.
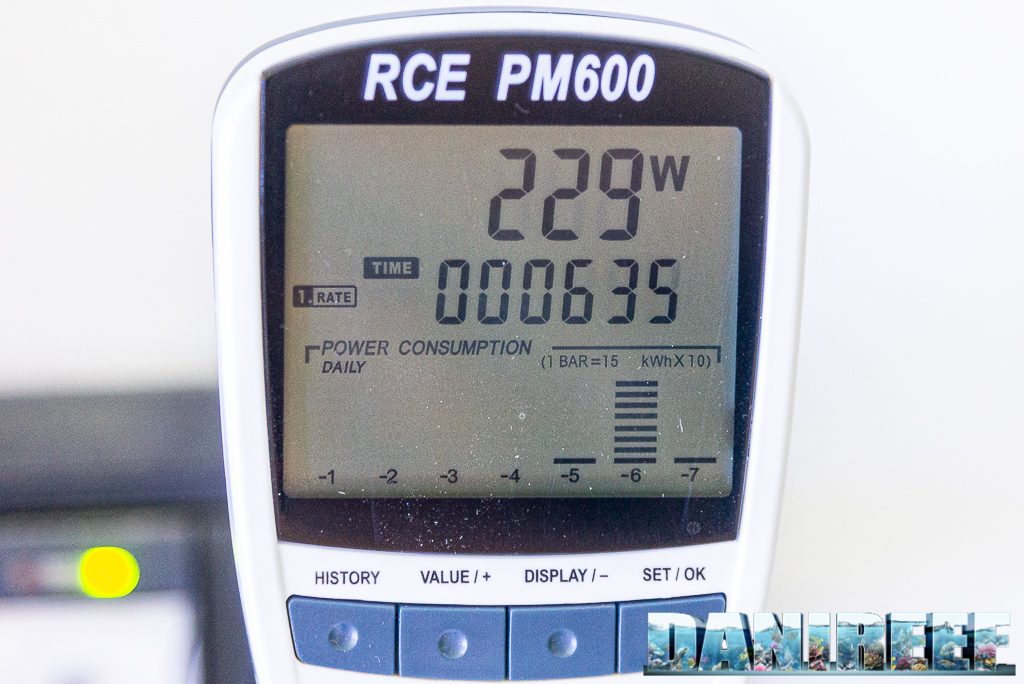
The Orphek Atlantik iCon LED light therefore consumes 229 watts. Value coinciding with the 230 declared. Optimal. Considering that at 17cm/6.69in the LED light develops 1774 μmol m-2 s-1 in the center, it can be said, in perspective, that it has a peak value of 7.74 μmol m-2 s-1 w-1 (PAR per watt ).
Orphek iCon and the heat
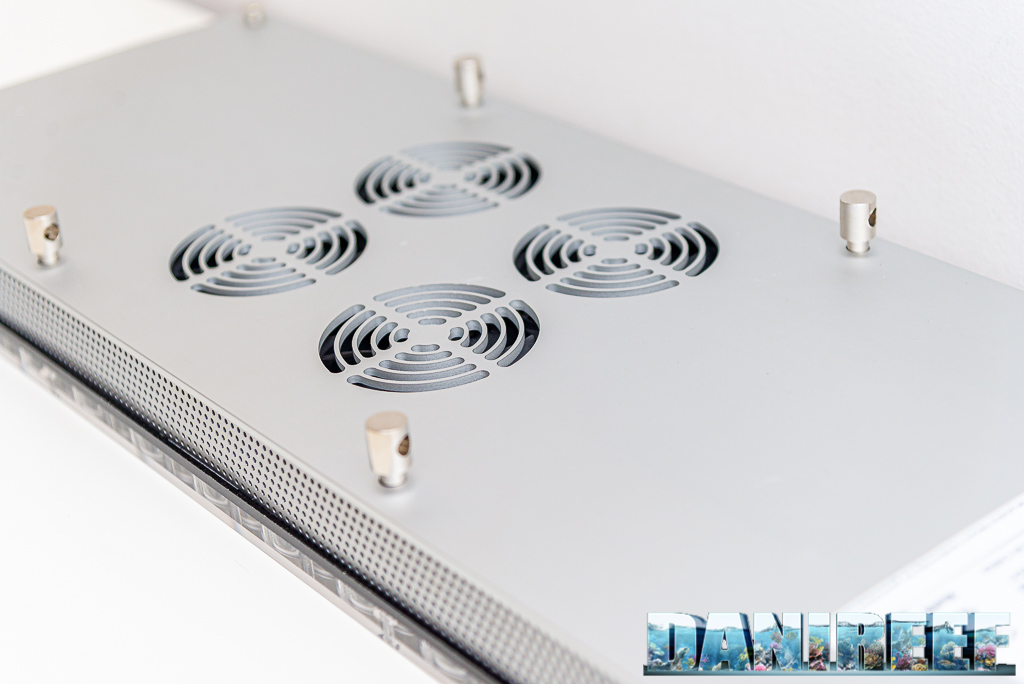
The Orphek iCon LED lights have a mixed active and passive cooling system, which uses four fans controlled by a sensor placed on the PCB. In addition to this, the external shell is made of aluminum to better distribute the heat.
STICK AROUND because in the next post DaniReef LAB we will finally post the table that shows comparison with consumption, cost energy, power per watt!
In this opportunity we would like to thank Danireef blog so much for this amazing Christmas gift for all Orphek development team!
How can I Order Orphek LED lights ?
- E-mail us and get a free consultancy from our sales representative near your location.
- we will send you a PayPal invoice and you can pay with your PayPal account or credit card.
- Free shipping -Withour Door to Door worldwide Express Delivery, your Orphek solution(s) will arrive any place in the world!
E-mail us to contact@orphek.com or fill this quick form (all fields required) and will contact you as soon as possible.
[contact-form-7 id="29322" title="Contact form 1"]