
Se leggerai l'intero articolo scoprirai perché il nuovo Orphek Atlantik iCon ROMPE TUTTI I RECORD
Blog di Danireef È la più grande fonte italiana per i reefer in Europa e per la nostra sorpresa ed eccitazione ha pubblicato di recente una recensione completa del nostro ultimo lancio, il Orphek Atlantik iCon .
Poiché si tratta di un articolo di 3 pagine pieno di molte misurazioni dettagliate, abbiamo deciso di dividere in 3 parti. In questo secondo post troverai i risultati delle misurazioni PAR che ti lasceranno a bocca aperta.
Sarai anche in grado di confrontare le nostre prestazioni di Atlantik iCon con altre marche con grafici interessanti.
Se ti sei perso il primo post clicca QUI
* Abbiamo anche pubblicato un'altra grande recensione LED da LED di Dana Riddle (clicca QUI Nel caso in cui ti sia perso).
Icona di Orphek Atlantic nella lab-Part2 di danireef
DaniReef LAB metodo di lavoro per la misurazione PAR:
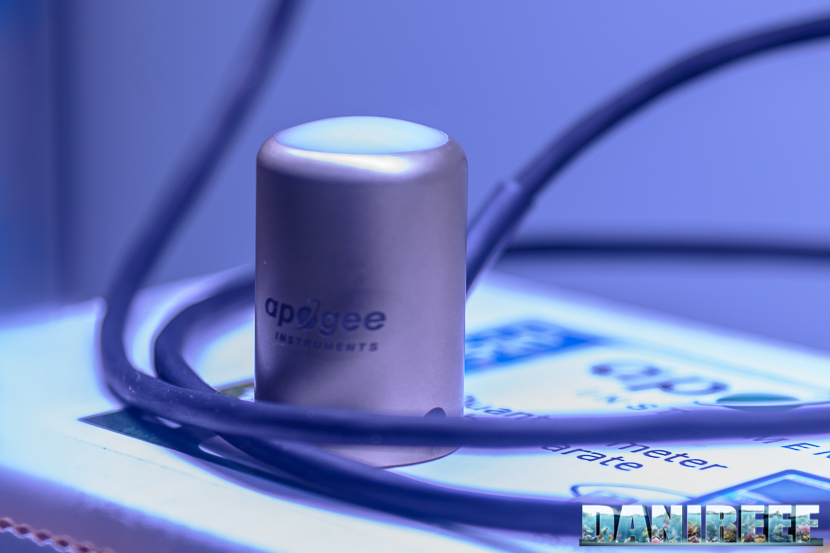
Il Quantum Meter MQ-510 misurare il PAR, espresso in PFFD o Flusso fotonico fotonico densità ( Densità del flusso fotonico fotonico ) Nel s-1 m-2 mol.
Lo strumento è calibrato per lavorare sott'acqua , Quindi quando viene utilizzato in aria il valore misurato deve essere diviso per 1,32 che è il fattore di immersione. Dal momento che non c'era acqua, al momento dei test, I valori che vedrai saranno sempre quelli già corretti.
Per testare la luce, è stata costruita una base di 70 × 70 cm con 17 punti contrassegnati dove posizionare il sensore del MQ-510 Quantum Meter.
Per posizionare l'apparecchio a LED abbiamo utilizzato misure di altezza di 20cm (7,87 pollici), 40cm (15,7 pollici) e 60cm (23,6 pollici). Questo ci permetterà di creare curve nello spazio che possono essere confrontate con quelle di altre luci, sempre alle distanze date.
Si noti che questa distanza viene misurata tra la base del sensore e la base della luce. In realtà la distanza va diminuita di 3,5 cm (1,37 pollici) che è l'altezza del cilindro di misura e aumentata di 0,5 cm (0,19 pollici) che è la dimensione dei distanziatori che permettono di mantenere sollevata la plafoniera.
In totale, le tre misure verranno poi effettuate a 17cm (6,69 pollici), 37cm (14,56 pollici) e 57cm (22,44 pollici) di distanza, nell'aria, e verrà applicato il fattore correttivo.
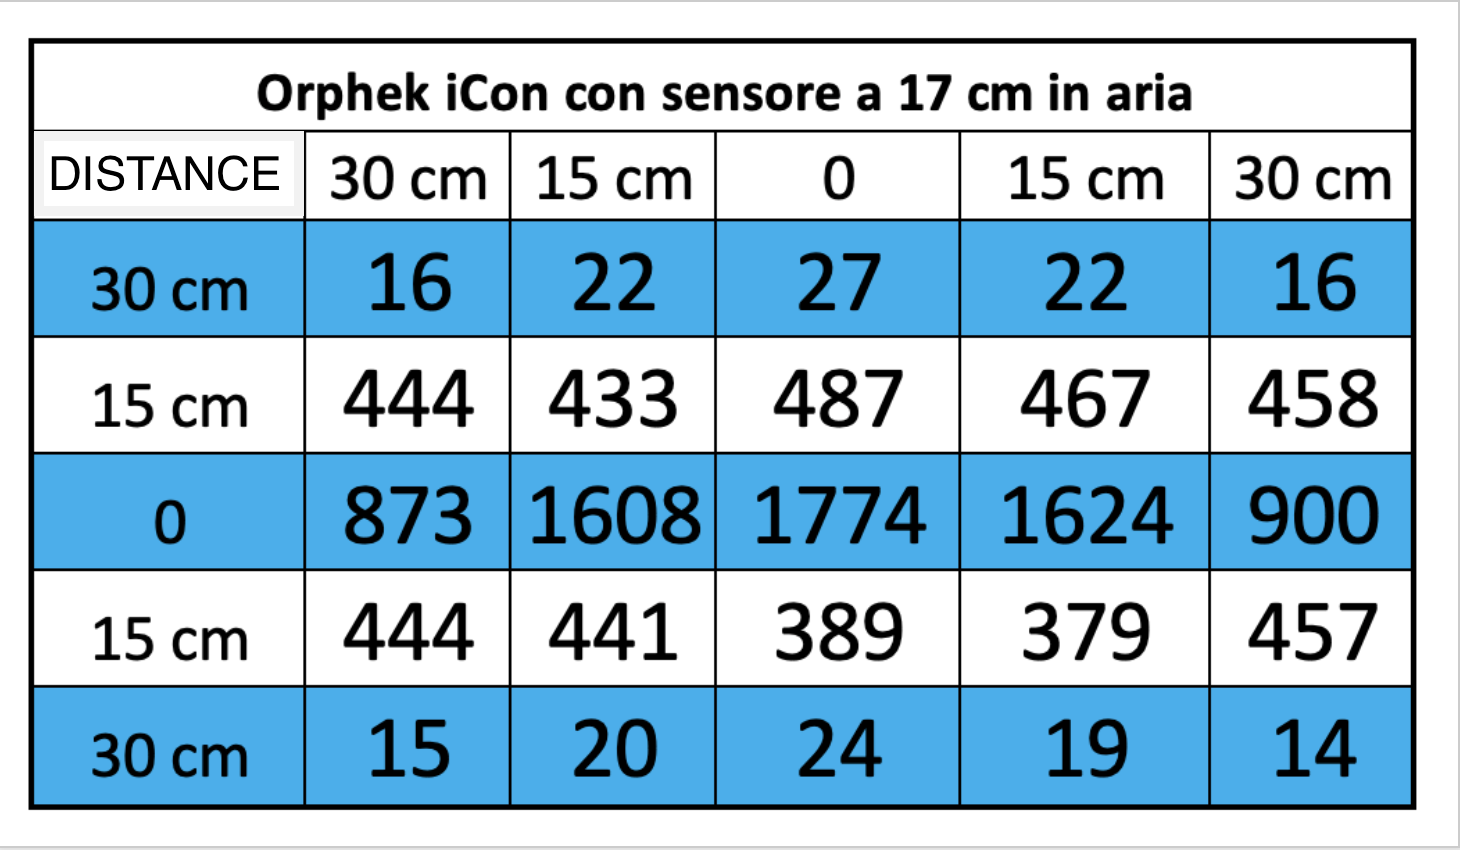
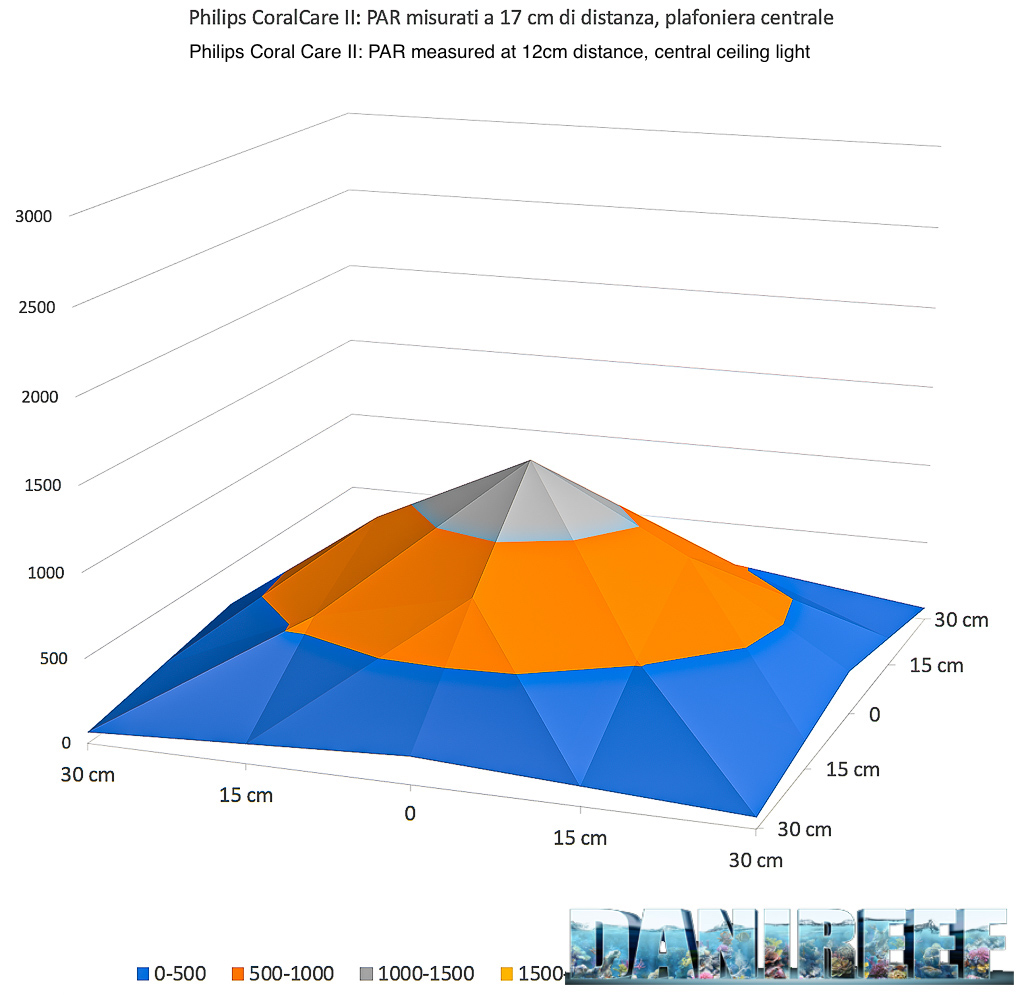
I valori PAR trovati a 17cm/6,69 pollici
La luce LED Orphek iCon, è stata collocata ai canoni 17cm/6.69in lontano dal nostro pannello di lettura.
I punti non indicati sul tabellone sono stati stimati nella tabella seguente.
E questo è il grafico corrispondente.
Siamo tornati alla nostra classica scala grafica per poter confrontare luci LED simili:
La prima misurazione ha la caratteristica di avere una distanza limitata tra la luce LED e il sensore. I valori espressi di PAR sono molto alti al centro ma soprattutto molto pieni lungo tutta la lunghezza, mentre anteriore e posteriore calano un po' bruscamente. Questo è anche ovvio considerando la dimensione della luce LED di 61,5 × 23,8 cm. (24,21x9,37 pollici)
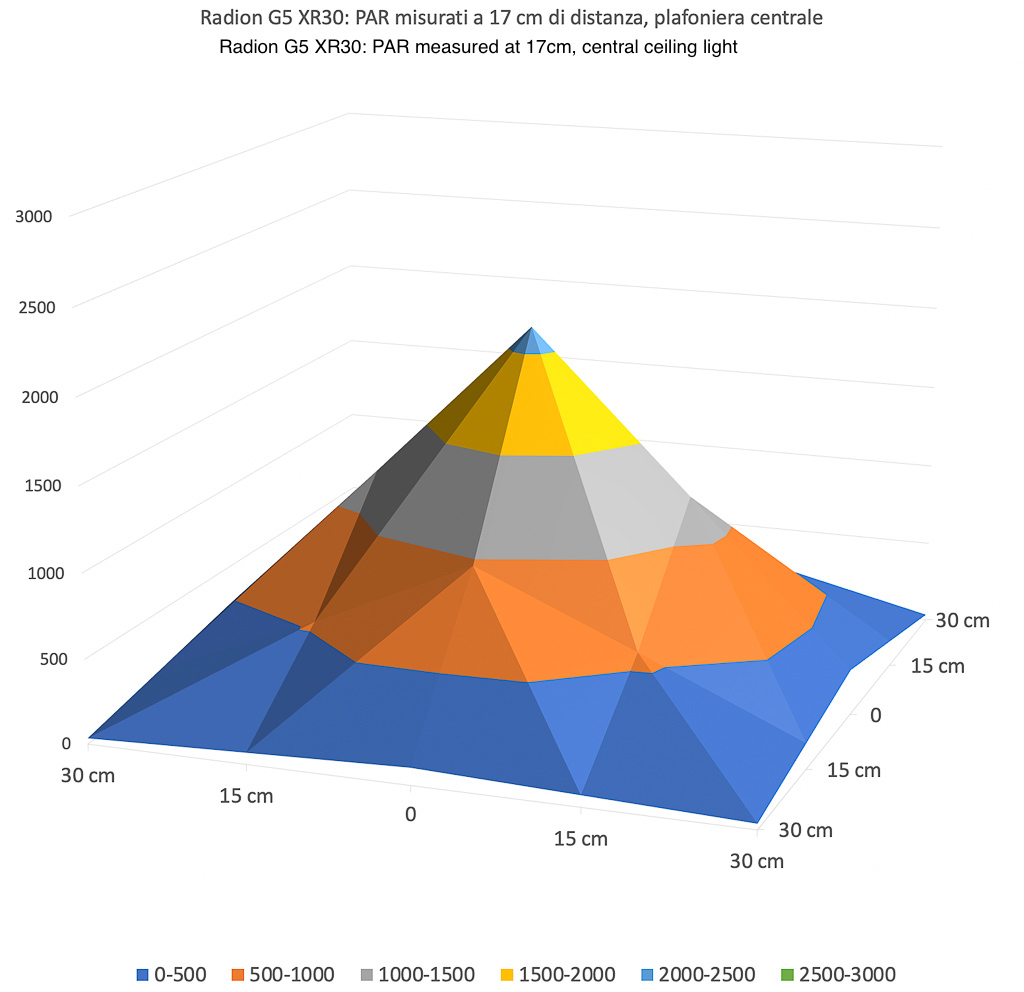
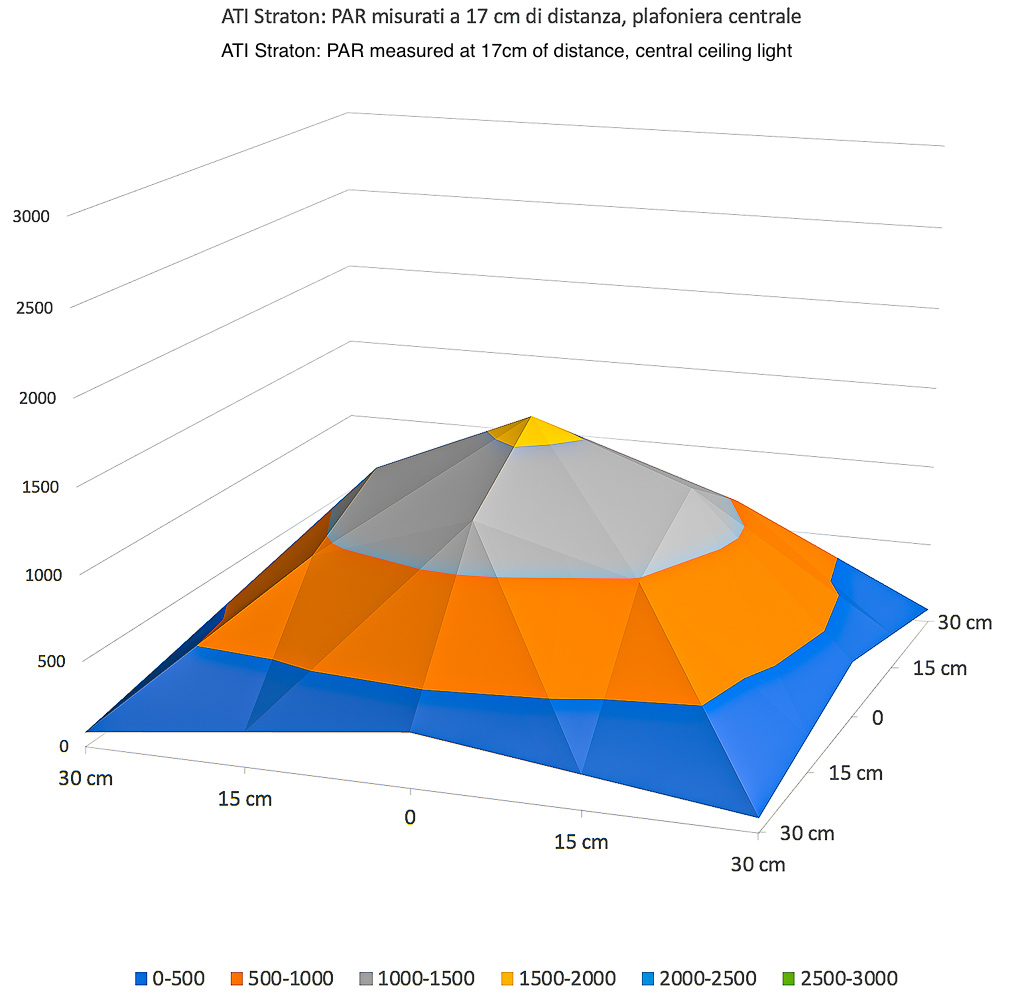
Misure Orphek Atlantik iCon PAR E altri:
I grafici hanno la stessa scala e il colore è lo stesso a livello PAR comparabile. Il confronto con tre luci a led della stessa classe, pur in qualche modo diverse dai consumi, evidenzia come i Radions abbiano una potenza di picco maggiore, ma una distribuzione comunque molto centrata, mentre ATI e Philips, pur essendo piuttosto centrate, mostrano una maggiore copertura davanti e dietro.
I valori PAR trovati a 37cm/14,56 pollici
Abbiamo posizionato 37cm/14,56 pollici di distanza, questi sono i valori misurati:
E questo è il grafico corrispondente:
Orphek iCon: PAR misurato 37cm/14,56 "di distanza, plafoniera centrale
Aumentando lo spazio tra la luce LED iCon Atlantik e il sensore, la curva assume una connotazione completa. Il valore di picco è incredibilmente alto , In quanto è vicino a 1000 PAR !!! Il valore centrale diminuisce da Dal 1774 al 966 μmol m-2 s-1.
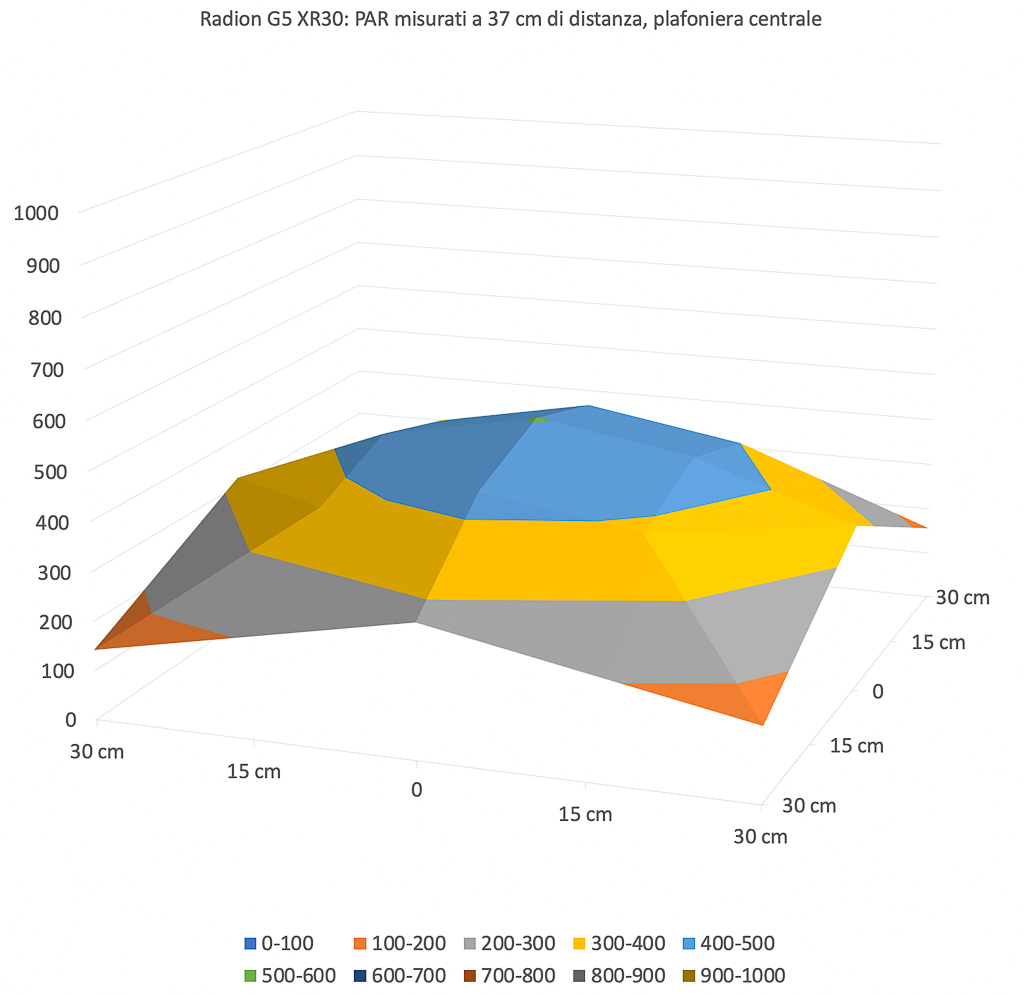
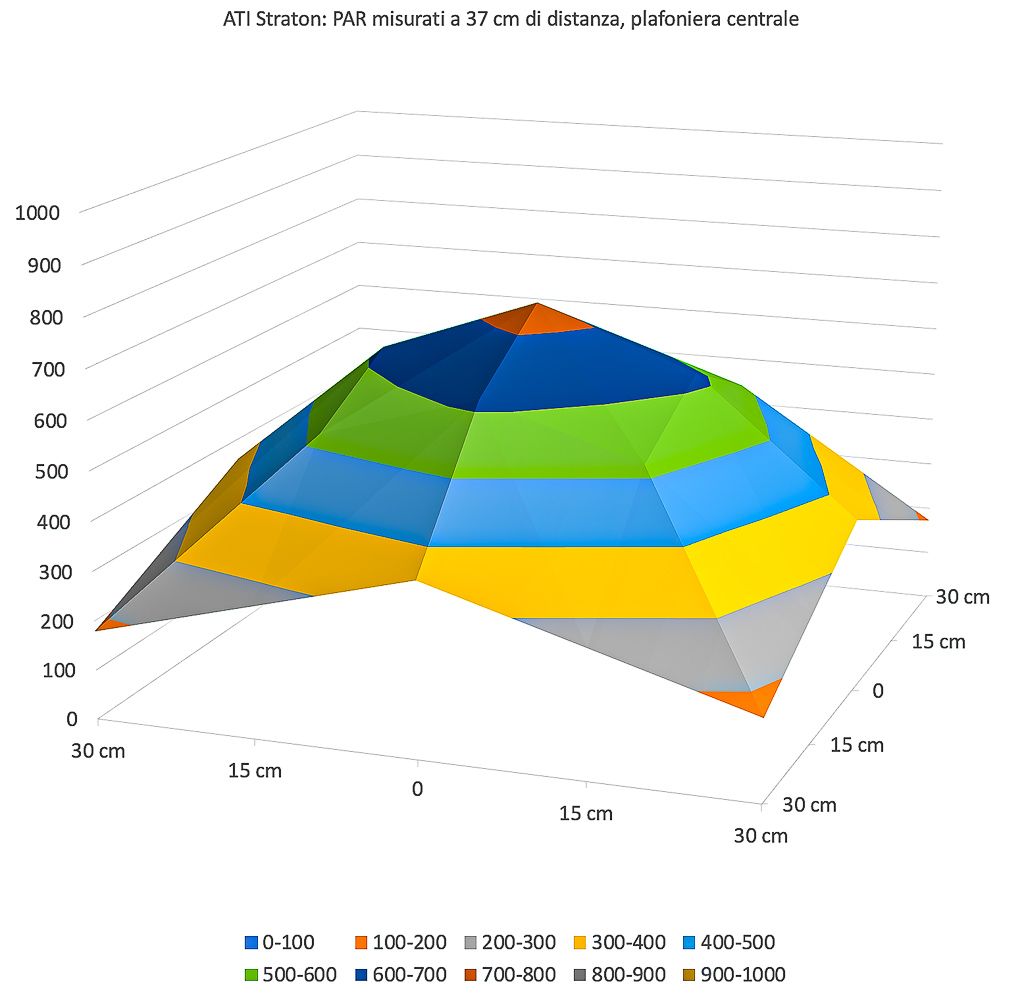
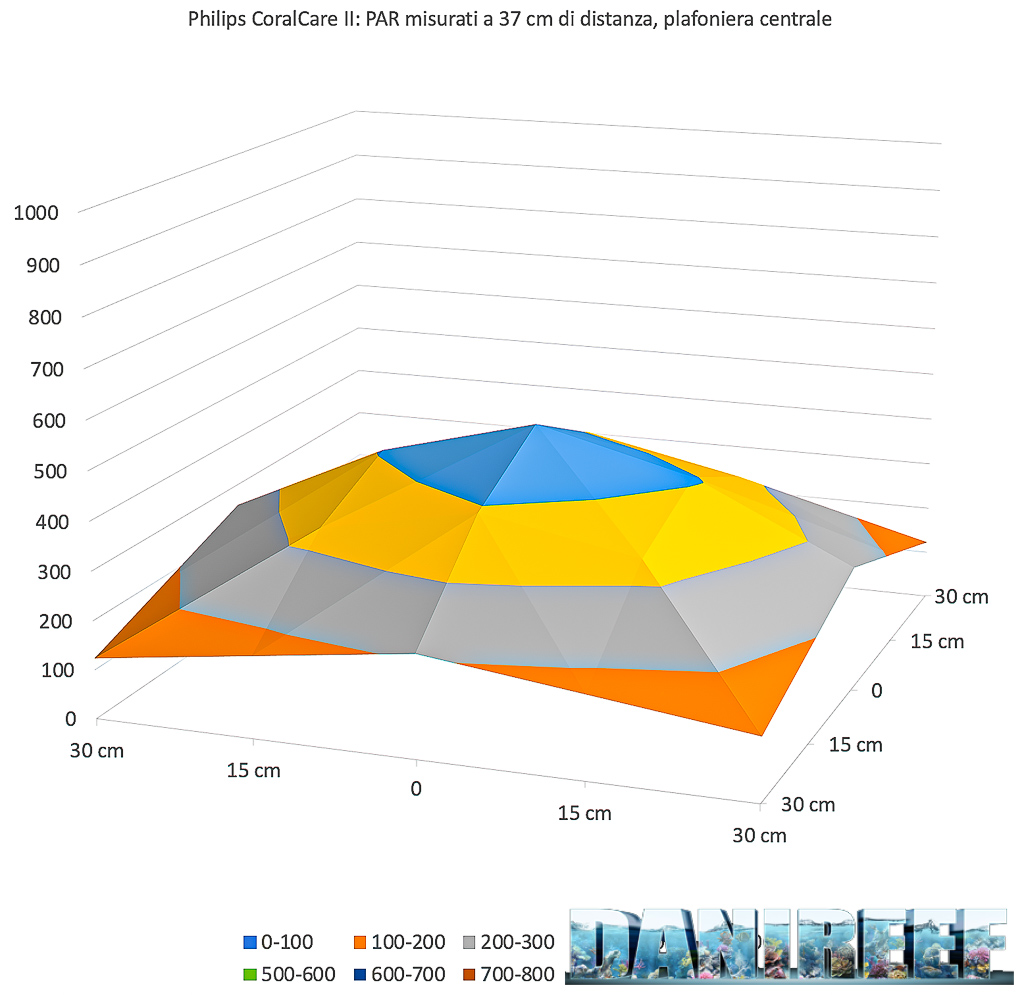
Allontanandosi di 37cm/14.56in dalla luce a LED, il grafico Orphek Atlantik iCon rimane simile, ma la potenza è Praticamente da record, quasi 1000 PAR Come abbiamo detto.
Mentre i tre antagonisti, pur con potenza leggermente inferiore, si piazzano a circa metà, a parte lo Straton che invece è a metà tra Orphek e il duo Radio-CoralCare. Ai lati il Orphek vince a mani basse , Mentre davanti e dietro cala più degli altri, dove per uniformità vince la Philips pur avendo meno potenza di tutte le altre.
I valori PAR trovati a 57cm/22,44 pollici
Finalmente siamo arrivati il più lontano possibile, a 57cm/22,24 pollici e questi sono i valori misurati:
E questo è il grafico corrispondente:
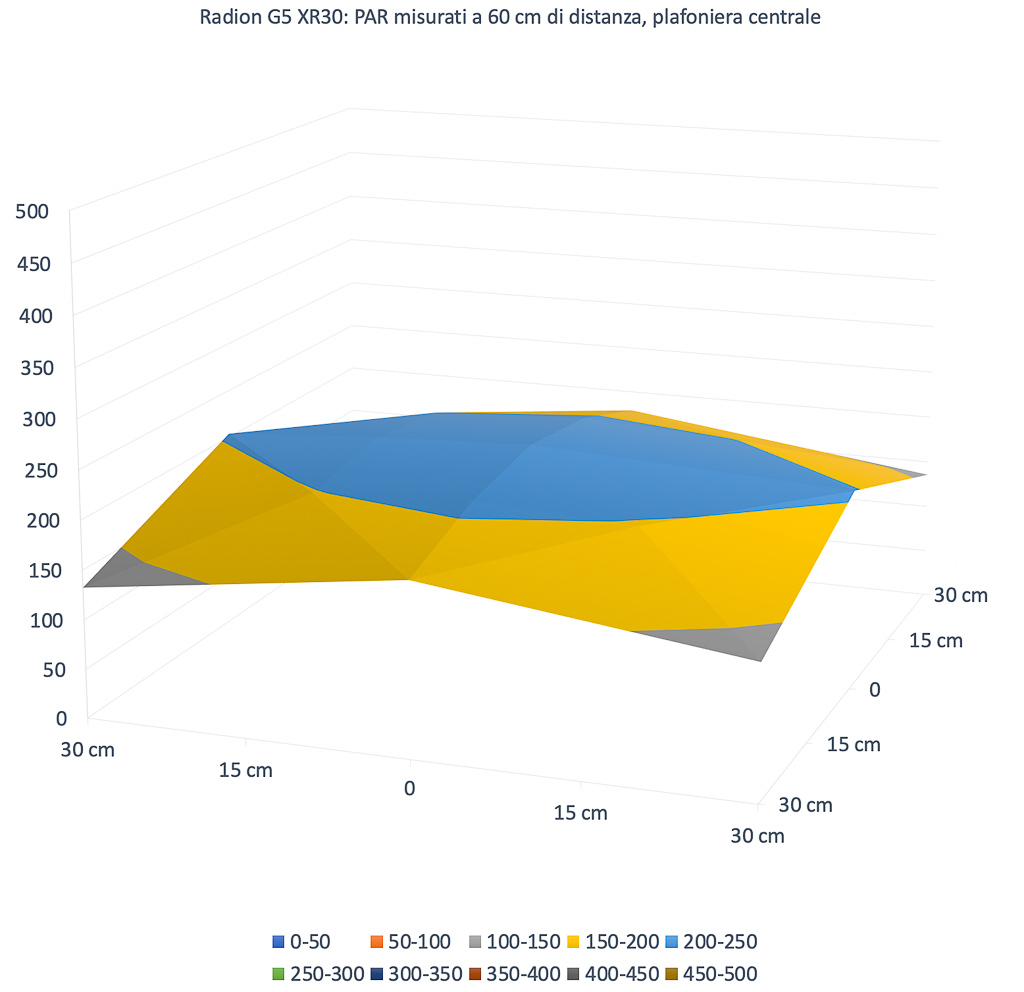
Orphek iCon: misurato con 60cm/23,62 pollici di distanza, plafoniera centrale
Fino ad ora abbiamo sempre utilizzato un grafico con il posto massimo a 500 PAR che pensavamo fosse molto conservatore, qui, l'Atlantik iCon è andato molto oltre, Picco di misura 620 PAR al centro . Per questo motivo abbiamo ricalibrato la curva, solo per questa luce LED, per farti apprezzare meglio la distribuzione della potenza luminosa.
Orphek iCon: PAR misurato a 60cm/23,62 pollici di distanza, plafoniera centrale
Ma per confrontare le seguenti luci a LED devi guardare il primo grafico.
Basta guardare il grafico per capire la potenza espressa lungo la linea centrale della luce Led iCon Atlantik. Il valore centrale diminuisce ancora da 1774 a 966 a 620 μmol m-2 s-1.


Le differenze rimangono le stesse di 37cm/14,56 pollici. A questa distanza l'Orphek Atlantik iCon è ancora più impressionante .
Ma gli altri tre coprono la distanza dal centro al bordo in modo più uniforme. Straton meglio degli altri due, ma bisogna sempre ricordare le differenze nella potenza delle tre luci a LED.
Il PAR al centro nelle diverse configurazioni
Continuiamo con i nostri sondaggi tecnici. Di seguito vediamo come in un grafico, le misurazioni PAR vengono abbassate al centro nelle tre diverse distanze del test.
Orphek iCon: dispersione PAR In base alla distanza misurata dal centro
Variazione energetica dell'Orphek Atlantik iCon basata sulla distanza
Orphek iCon: energia totale emessa dalla luce nell'intervallo scelto
A mio parere, questo è il dato più significativo tra quelli misurati e il più comparabile. La variazione energetica. I volumi sottesi dalle tre superfici viste in precedenza sono stati calcolati.
Perché è ovvio che allontanandosi dalla luce a LED i valori di PAR diminuiscono, ma diminuiscono anche perché la luce illumina uno spazio più ampio. In questo modo si cerca di tenere conto di tutta l'energia luminosa contenuta nell'ipotetico quadrato di 60cm/23,62 in sotteso dalla luce a LED. E si vede che i tre valori 1.469.474, 1.286.030 e 1.155.746 assumono una connotazione diversa rispetto ai valori misurati al centro.
Quando i primi sono calanti perché aumentano le distanze, l'area sottostante, cioè l'energia, diminuisce meno, perché il "grosso" della plafoniera "concentrata" resta al centro. Questa è la teoria.
Per l'iCon i valori sono quasi "identici" alle tre distanze, ciò significa che tutta la luce espressa, o comunque la maggior parte di essa, rimane entro i 60cm/23,62 pollici.
Eccellente per serbatoi larghi fino a 60cm/23,62 pollici, un po 'meno per acquari larghi invece 70/27,65 pollici o 80cm/31,49 pollici.
Valori per canale al centro nelle tre distanze
Abbiamo anche misurato i valori per ogni singolo canale, ma lo abbiamo fatto solo al centro, per darti un'idea di quale contributo hanno i diversi canali sull'uscita PAR.
I sei canali sono ovviamente diversi, ma non troppo. La singola incidenza, inoltre, varia molto con la distanza, probabilmente perché quando sono molto vicini allo strumento la luce dei Led non si espande abbastanza da eccitarla completamente. Tuttavia, vediamo che i canali 2, 4 e 5 sono quelli con i PAR più alti, ma a parte il primo, il più bianco di tutti, gli altri sono abbastanza vicini a 40cm/15,74 pollici di distanza.
Consumo
La rilevazione del consumo istantaneo è stata resa possibile grazie all'utilizzo del comodo strumento RCE PM600 che è anche in grado di misurare il Cos (fi) (o sfasamento). Il risultato è dato direttamente in watt.
Il Orphek Atlantik iCon La luce LED consuma quindi 229 watt . Valore coincidente con i 230 dichiarati. Ottimale. Considerando che a 17cm/6,69 pollici La luce a LED si sviluppa 1774 μmol m-2 s-1 Al centro, si può dire, in prospettiva, che ha un valore di picco di 7,74 μmol m-2 s-1 w-1 (PAR per watt ).
Orphek iCon e il calore
Le luci Orphek iCon LED hanno un sistema di raffreddamento misto attivo e passivo, che utilizza quattro ventole controllate da un sensore posizionato sul PCB. Oltre a questo, il guscio esterno è realizzato in alluminio per distribuire meglio il calore.
STICK INTORNO perché nel prossimo post DaniReef LAB pubblicheremo finalmente la tabella che mostra il confronto con i consumi, il costo dell'energia, la potenza per watt!
In questa opportunità vorremmo ringraziare Blog di Danireef Così tanto per questo fantastico regalo di Natale per tutto il team di sviluppo di Orphek!
Come posso ordinare le luci a LED Orphek?
- Inviaci un' e-mail e ottieni una consulenza gratuita dal nostro rappresentante di vendita vicino alla tua posizione.
- Ti invieremo una fattura PayPal e potrai pagare con il tuo conto PayPal o carta di credito.
- Spedizione gratuita-Withour Consegna espressa porta a porta in tutto il mondo, La tua soluzione Orphek arriverà in qualsiasi posto nel mondo!
Inviaci un' e-mail a Contact@orphek.com O compila questo modulo rapido (tutti i campi richiesti) e ti contatterà il prima possibile.
[Modulo di contatto-7 id = "29322" title = "Modulo di contatto 1"]